Successful with SEO-KPIs – What is really important?
15 min
eologyeo:magazineSuccessful with SEO-KPIs – What is really important?
There are now countless key performance indicators, or KPIs for short, which are used for a wide variety of areas. For this reason, there are of course also key performance indicators for SEO, which should evaluate the achievement of objectives. So you can make your SEO success measurable. But which key figures are really fundamental and relevant? You can orient yourself on the question, “What are good SEO goals for me?”. We will go through the various SEO KPIs with you here to be able to better assess this.
KPIs are key figures, on the basis of by which it is to be determined whether and how well target projects have been implemented and achieved. But beware: Not every key figure is automatically a KPI. These are really only the key performance indicators, that make you successful. They’re important because without defined KPIs you can’t exactly track and measure, whether something has improved quantitatively. There are several directions in which KPIs can be set:
Operational
Strategic
Technical
Organizational
Financial
This allows you to pinpoint all the events that happen on your website, define KPIs for them, and finally evaluate them. This helps you to control the performance more easily – keyword success control. In this way, you uncover successes and failures and can adjust further measures accordingly.
Why do you need SEO KPIs, and how do you set them?
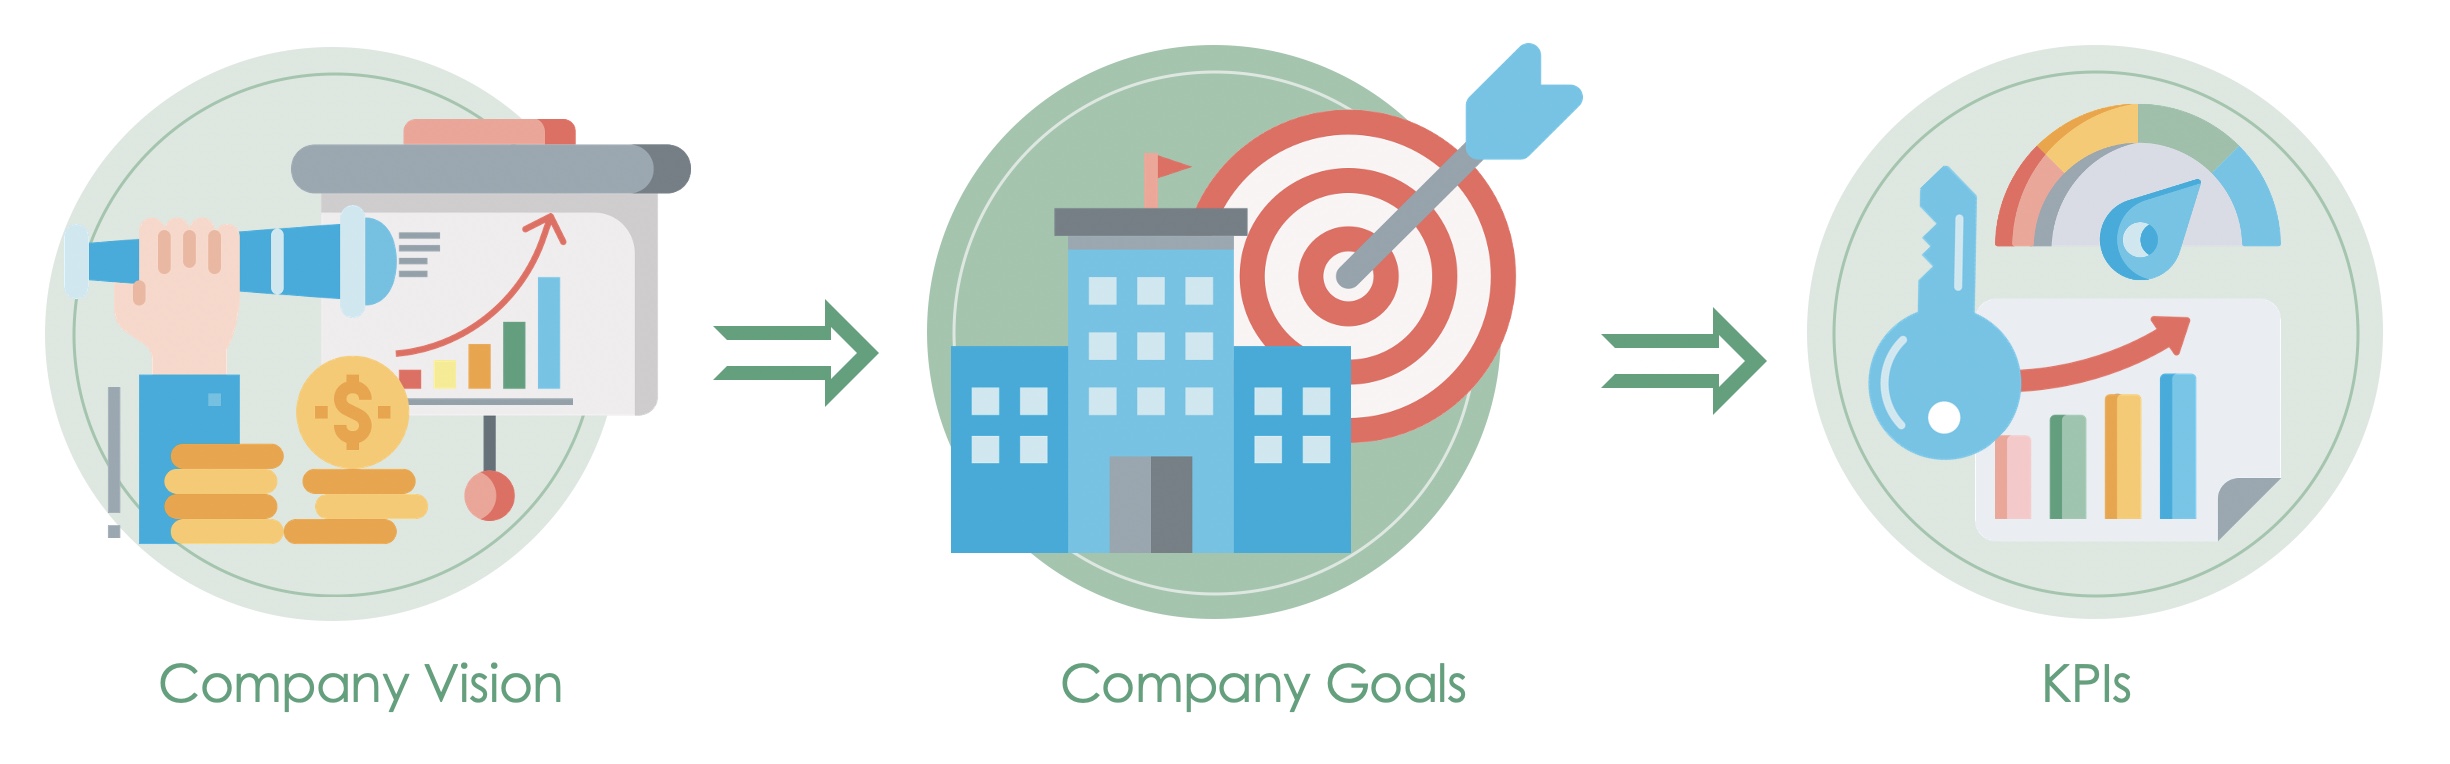
KPIs you need whenever you want to assess the success of various measures. The procedure for setting target values is relatively easy. In the first step, you look at your company vision and the company goals linked to it. On the basis of these, you can see what you would like to achieve. Finally, you determine the key performance indicators that will help you assess these goals.
Procedure for setting KPIs in the company
But control is not the only key area of application for KPIs. The evaluated numbers have an informative effect and can be helpful for monitoring your methods.
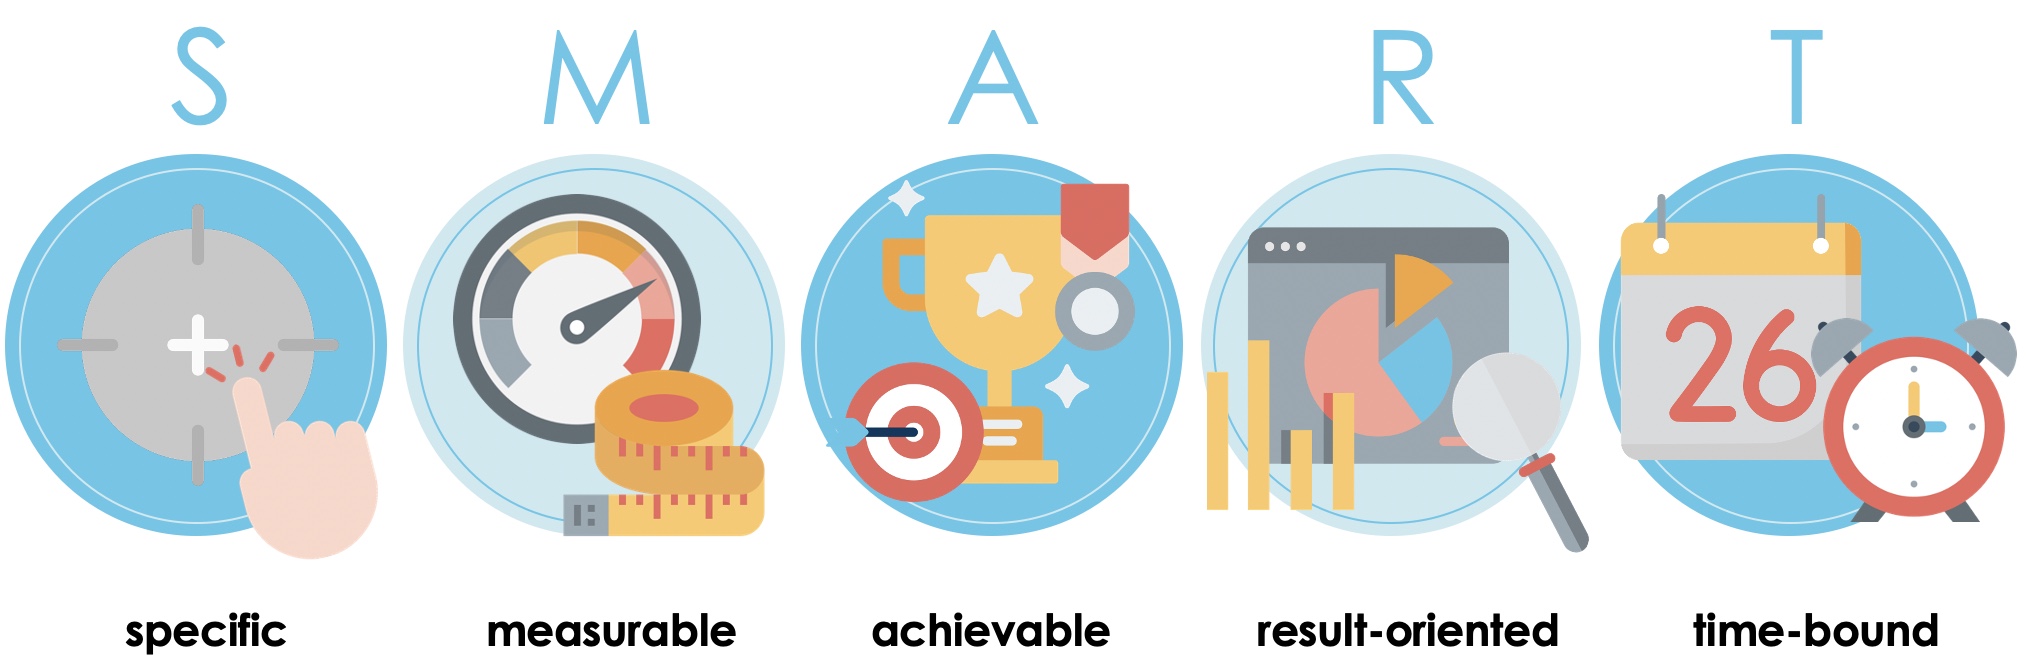
To define your key performance indicators as concrete as possible, it is best to use the SMART method. It builds up as follows:
Specific Be as concrete and specific as possible. Avoid generalizations and prevent ambiguity.
Measurable Use measurable quantities; both qualitative and quantitative.
Achievable Make sure your goals are also achievable. Set an incentive that encourages you to actively work towards the goals.
Result-oriented The goals must be realistically achievable – anything else will lead to frustration.
Time-bound Terminate your goals. A deadline helps you plan and makes for more structured work.
Development of the SMART goals
However, KPIs must always be defined individually, as the targets are never universally valid for several industries or companies.
Implementing KPIs
Once you have defined your KPIs, you should make sure that they also receive attention and are analyzed. At best, you can do this with an analytics system that prepares the numbers for you. However, the more individual and complex your KPIs are defined, the more complicated this process becomes. Standardized analyzes no longer really help you in this case. Instead, you have to make use of the more complex customizing. Here, however, you should clearly weigh up whether the costs and effort for your benefit are really worthwhile and whether this results in added value for you. Otherwise, you should revert to simpler, standardized indicators to measure success.
These are the most important SEO-KPIs
There are several metrics that are particularly important in SEO. Therefore, you should definitely take a look at these numbers. Nonetheless, it’s important that you individualize here as well and, for example, go into detail about a specific subpage of your domain.
Visibility index
Everyone who deals with SEO has heard of it: the visibility index. This metric gives you a clarified view of positioning within search results, and thus the value of your website. The best-known version of the visibility index belongs to the SEO tool Sistrix, but others such as Xovi or similar also calculate this value for you. It is determined on the basis of an immense keyword data set, which covers terms from the most diverse subject areas. Thus, not only the most common search terms are used, but it additionally ensures that current events are also included and weighted. Since each tool provider uses different data sets as a basis, however, there may be deviations here. So work at best constantly with a tool to be able to compare the values of your visibility index perfectly with each other. No matter which tool you use, one thing remains the same: The value is recalculated at regular intervals – usually once a week. The basis for calculation is the following:
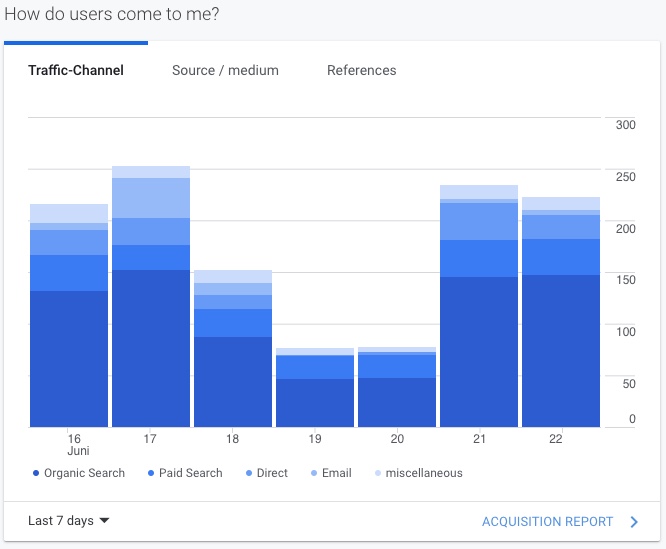
Organic is the opposite of inorganic – logically. But what does that mean in terms of SEO? Traffic occurs every time an internet user accesses your website. Organic traffic, however, only ever occurs when the visitor does not reach your website via paid ads. Otherwise, this would be paid traffic and must be clearly separated from the organic traffic, as this would falsify your evaluations. You can see the distribution of your website accesses, for example, at Google Analytics. Here you will find on the home page the section “How do users come to me?”, which already gives you a good overview of the number of visitors and their origin on your website.
“How do users come to me?” you can find out via this section on the home page of Google Analytics
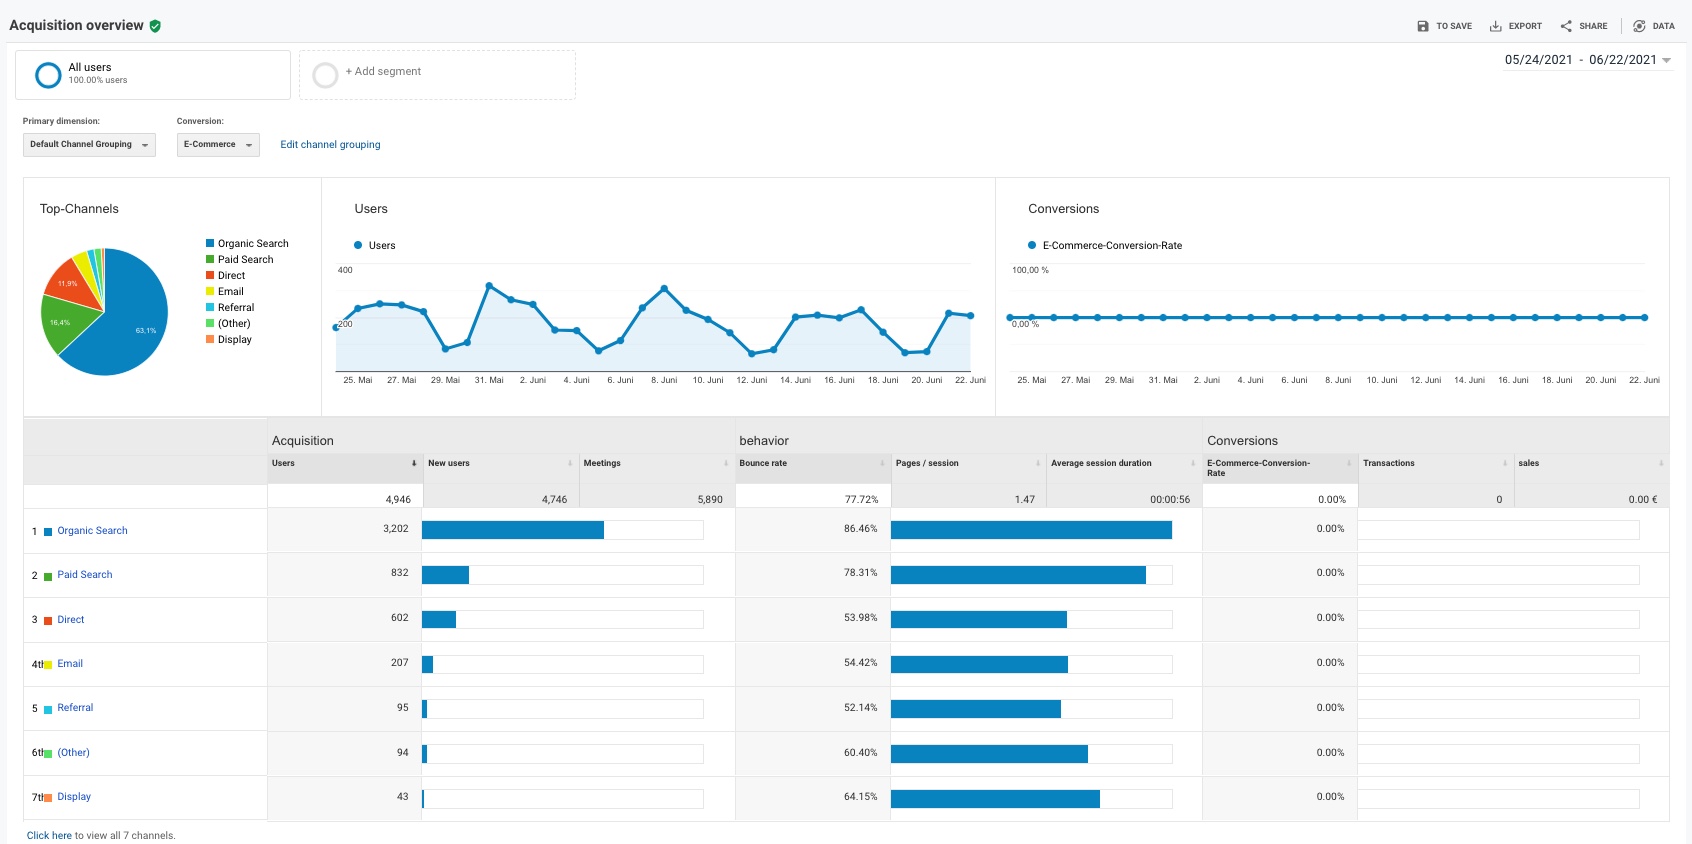
If you then click on the acquisition report, you get even more detailed insight into visitor numbers. This gives you information about how your users get to your website.
With the help of the acquisition overview of Google Analytics, you can perform detailed analyses of your visitor traffic.
CTR
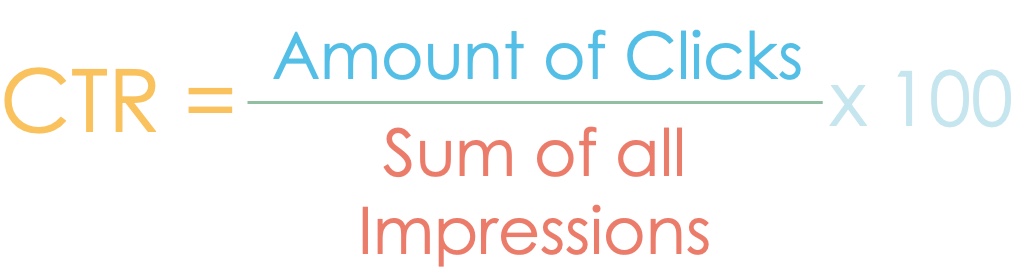
CTR is the abbreviation for click-through rate. This metric gives you the ratio of clickson a search result to the sum of impressions on – that is, how often the result was actually played out to the user with visual contact. To get a percentage, you have to multiply it by 100. With this KPI, you can check how effective your snippets are in the SERPs. From this, you can derive optimizations and adjust the title or description of your “short preview” of the website in the search results. This will make it more attractive for clicks and your CTR will increase.
Formula for calculating the click-through-rate
Bounce Rate
Using the bounce rate you can analyze how many visitors leave your website again,without accessing any subpage. This can be analyzed quite easily, since only one page view happened. By default, this value is expressed as a percentage and is calculated as follows:
Formula for calculating the bounce rate
The bounce rate is important because you can use it to draw conclusions about the quality of your page. For example, if there is a lack of content quality, the page does not load fast enough. If the user even lands on a 404 page, this leads directly to the bounce. However, it is different with encyclopedias, one-pagers or similar. Here, the user normally receives the answer to his question within one page and therefore jumps off again without further clicks on other pages. Therefore, it is also interesting for you to know at which point the website visitors leave the page. So in this context, the following metric is also important: the exit rate.
The Return to SERP time, i.e. the time between page load and return to the results page, also helps you to assess the page quality. You can also use this as an SEO KPI. Based on the duration of the session, you can determine relatively easily whether the visitor bounced because he did not find what he was looking for, or whether his question was answered. You can analyze this time, for example, by using the Google Tag Manager.
Exit Rate
Be careful of confusion! Unlike bounce rate, exit rate analyzes which was the last page that the user visited. It does not matter if five, ten or more subdomains were visited in between. As long as the visitor returns to the first page he started with, it counts as a bounce page. The sum of the total visited web pages is thus only relevant for the bounce rate, but not for the exit rate. Through the exit rate, you can therefore determine whether one of your pages was conspicuously often the last, which was visited. Here you will find then not exhausted optimization potential, on which you should work.
Important: It is different, of course, if the last page is the conclusion of an ordering process or similar.
Dwell time – how long and where?
The dwell time is often given as the average of the total session duration. It shows you how long users have stayed on your pages. You can analyze this for individual pages, but also for your entire domain. The whole thing is important in relation to your content, because it can give you insights on their quality. This is due to the fact that users often reach your site via specific search queries. This means that they are searching for information. If your site does not provide the right answer, users will leave it pretty quickly. In addition, this gives you an insight into the usability, i.e. the user-friendliness, of your page, as this also strongly influences the dwell time. In this context, it is also interesting where your users hang out. So you can see what content they are most interested in and what they like.
Top
Viewed Pages
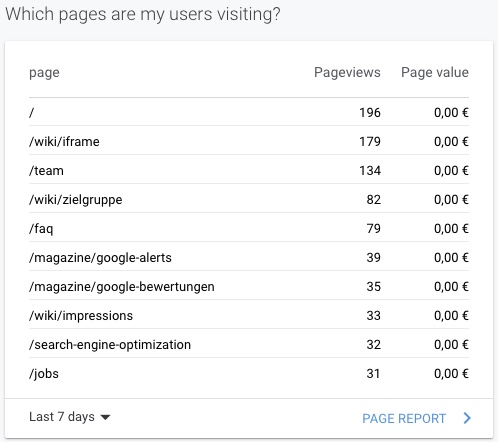
Just like the pages that lead to the drop-off, the pages that are visited the most are of course also interesting. This is where it gets exciting, because you can find out what you are doing right and why users find this page particularly good. This can also be determined relatively easily via Google Analytics. For this purpose, you can view the section “Which pages do my users visit?” on the homepage. Here you will find a clear list of your top pages that are visited by users. The number of page views is the decisive indicator here.
“What pages are my users visiting?” is the answer in this section on the Google Analytics home page.
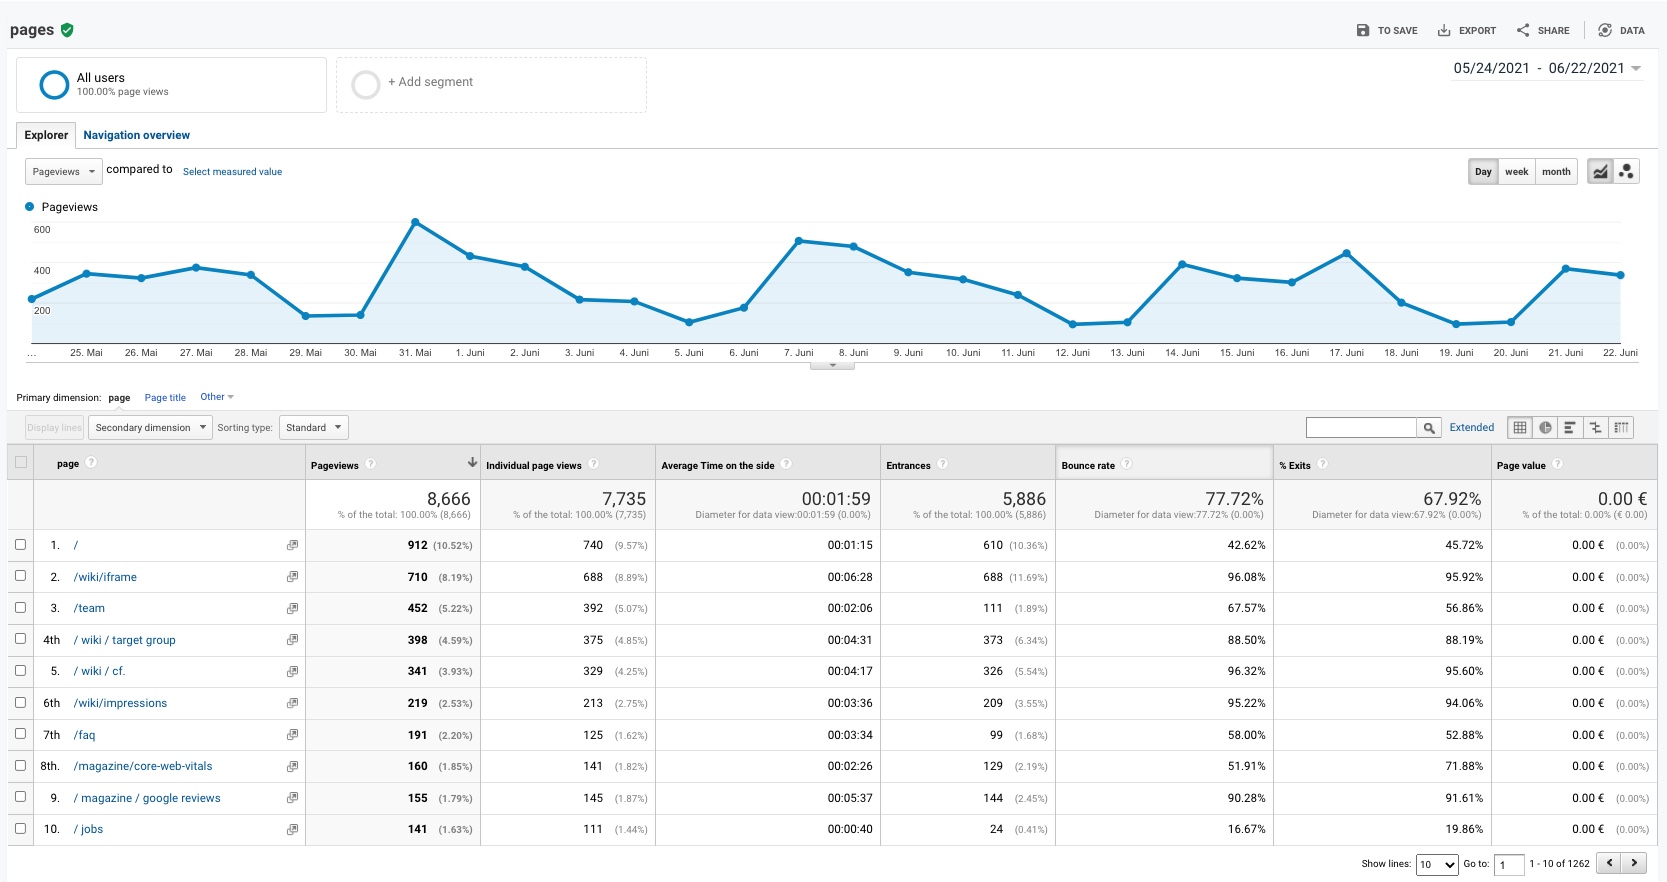
To get more detailed insights, you can click on the page report. This opens another area of Google Analytics, which can provide you with information for further optimization measures.
The Google Analytics page report not only shows you page views over time, but also gives you insights into the top pages of your website.
PageSpeed
PageSpeed is actually self-explanatory: it describes the time, it takes until your page is fully loaded. So it is measured how long the duration between the sent request and the complete loading of the page. This is important because it has a strong influence on the bounce rate and usability of your website. With a bad loading time, not only the nerves of the users are strained, but in the worst case also the conversions diminished.
There are several factors, that affect the speed at which your page loads. However, you can’t influence all of them directly. The bandwidth at which the visitor surfs is one of them, for example.
Nevertheless, there are of course clearly influenceable factors:
Size and format of the images used
compression of CSS and Java script
The server on which the website is resides and the number of other websites also running through that server. Websites
To test your own load time, you can refer to the Google tool “Page Speed Insights”. Here, you can analyze the speed for both desktop and mobile versions of your page.
Leads
Of course, the leads are also interesting because it’s, every contact you got because of effective online marketing measures. Another benefit: Behind every lead there is a potential customer. In most cases, you receive direct address data or information, such as e-mail address or telephone number, what makes it easy for you to contact them. Here you can start to acquire new customers.
Conversions
Only clicks and leads say little about the actual success of your website. Sure, it’s a nice-to-know, yet you’re certainly most interested in where something really happened. This doesn’t always have to mean that your revenue directly increases. A conversion can also be a newsletter signup, a download, a contact request, etc. This depends on how you define your conversions. So, a conversion happens whenever you manage to convert people of your target group to actual prospects.
Conversion
Rate
In the course of conversions, the conversion rate also becomes interesting. This gives you the exact ratio of visitors to completed transactions. Again, this value is given as a percentage.
Formula for calculating the conversion rate
Core Web Vitals
As of June 2021, Core Web Vitals are also an important factor. They measure a page’s PageSpeed and factor into the ranking factor Page Experience. The Core Web Vitals consist of three parts:
LCP – Largest Contentful Paint (Loading Time)
FID – First Input Delay (Interactivity)
CLS — Cumulative Layout Shift (Visual Stability)
The three metrics help to take a closer look at the performance of a page. Get more details in our detailed article about Core Web Vitals!
Conclusion
As you can see, there are several standard SEO KPIs that you can use to measure your success. Since these are the most commonly used metrics, you should definitely utilize them to compare yourself to your direct competition. Nevertheless, you should not disregard individualized KPIs to get the perfect overview and derive the best possible measures for the future.