The Google Search Console: An introduction to the analysis tool
07 min
eologyeo:magazineThe Google Search Console: An introduction to the analysis tool
In today’s digital era, a strong presence in search engine results is crucial to maximise online visibility and traffic. Search engine optimization (SEO) plays a central role in improving a website’s organic visibility; data-driven analysis and the use of analytics tools, such as Google Search Console, are invaluable. By collecting and analysing relevant data, companies can make informed decisions to optimise their domain and increase their online performance.
One of the most important tools for data-driven analysis in SEO is the free Google Search Console (GSC). It offers a wide range of website performance data, including search queries, impressions, clicks and rankings. This data can be used to understand website performance and identify areas for improvement. In this magazine article, you will learn where to find this data within the Google Search Console and what to look out for when using the tool.
How do I set up the GSC?
To set up the Google Search Console (formerly Google Webmaster Tools), you must first log in to the Search Console with your Google account. Once you have logged in, you can add your website.
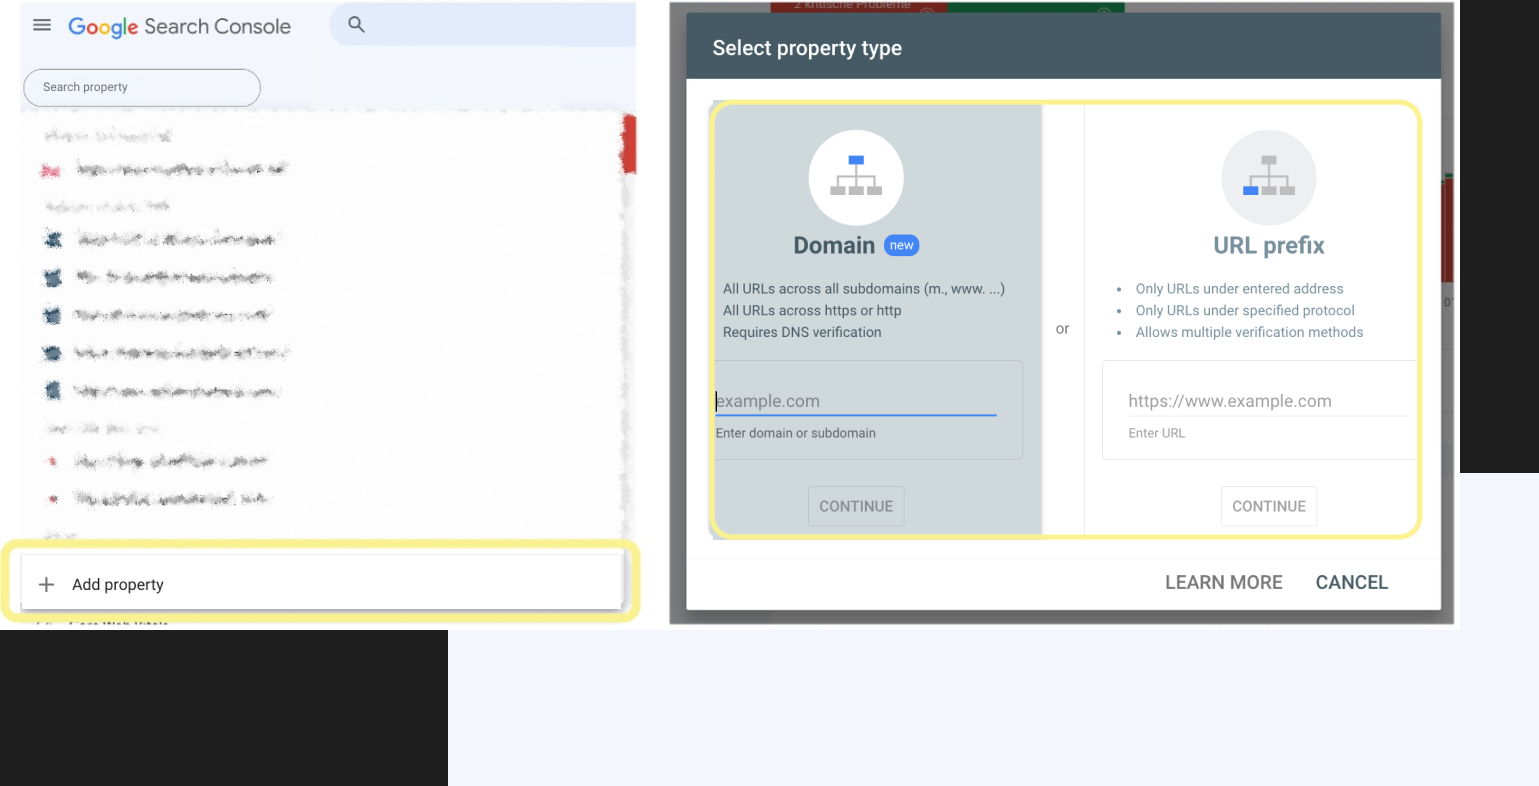
To do this, click on the button “Add property“.
A pop-up window will then open in which you can choose between a domain property and the URL prefix.
If you set up a domain property, data is collected on all subdomains and protocol types, while the prefix variant collects information on URLs that start the same.
Figure 1: Add property in the GSC
With the URL prefix, data can be collected in a more targeted way, which means you have to filter less during the analysis. To do this, simply create several URL prefix properties.
Now you need to confirm the ownership of the domain. There are several verification methods to verify your website.
Upload HTML file: You need access to the hosting system for this.
Include HTML tag: In the source code of the start page
Analytics tracking code: An Analytics account is required for this.
Domain name provider (for domain properties): DNS entry in the domain provider’s entry list
Choose the variant that is easiest for you to implement.
Then return to the Google Search Console and click on “Verify“. If the verification was successful, the first data will be displayed after a few days and you can start the analysis.
User interface with reports
The GSC is divided into three main sections in terms of structure and layout to allow easy navigation between the important information about the performance of the website.
Overview: This section provides an overview of your website’s performance in the search results. You can also use the URL check to get a quick overview of individual landing pages.
Performance: Here you can find detailed information about the performance of your website for specific keywords and landing pages.
Technical: This section consists of several clusters and provides information about the technical configuration of your website and how it is perceived by Google.
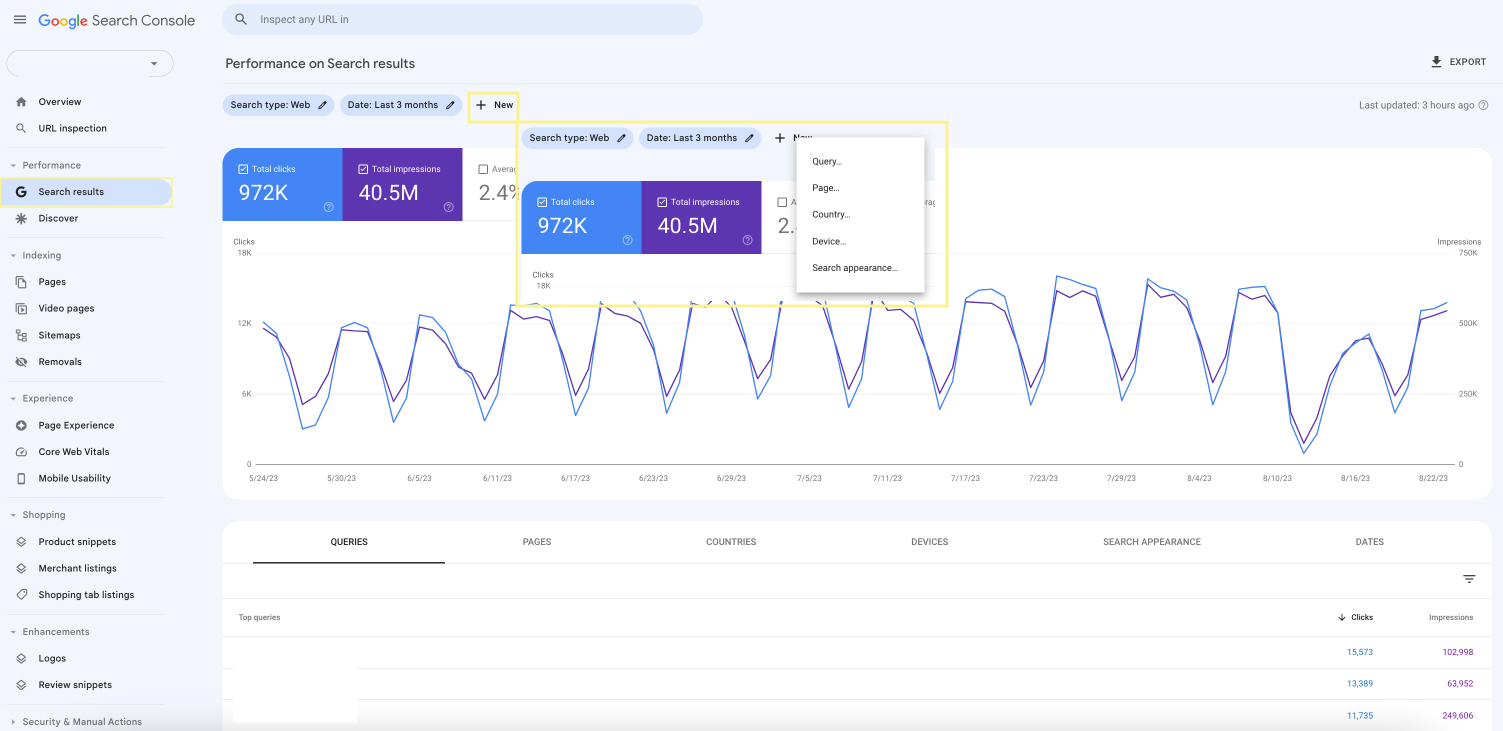
The performance report
You will probably work with this report most often, because here you will find the KPIs that are important in SEO:
You can display each of these key figures in a defined period of up to 16 months at both keyword and URL level.
Depending on the reason for the analysis, you can customise the filter options within the Google Search Console performance report.
Figure 2: Screenshot of the performance report with filter arrangement
If a keyword generates less traffic than usual, for example, you can use the filter option “Search query”. Enter the exact keyword here to view the development over time. If this is not sufficient as a basis for data, you can select a comparison period and see whether, for example, the position has deteriorated or whether the CTR has fallen. Based on the results, either a SERP & potential analysis or meta-data optimisation can be considered.
If you are being played on Google Discover or News, you can pull all the traffic information from individual sub-reports within the performance report.
Check indexing and technical aspects within Google Search Console
Indexation
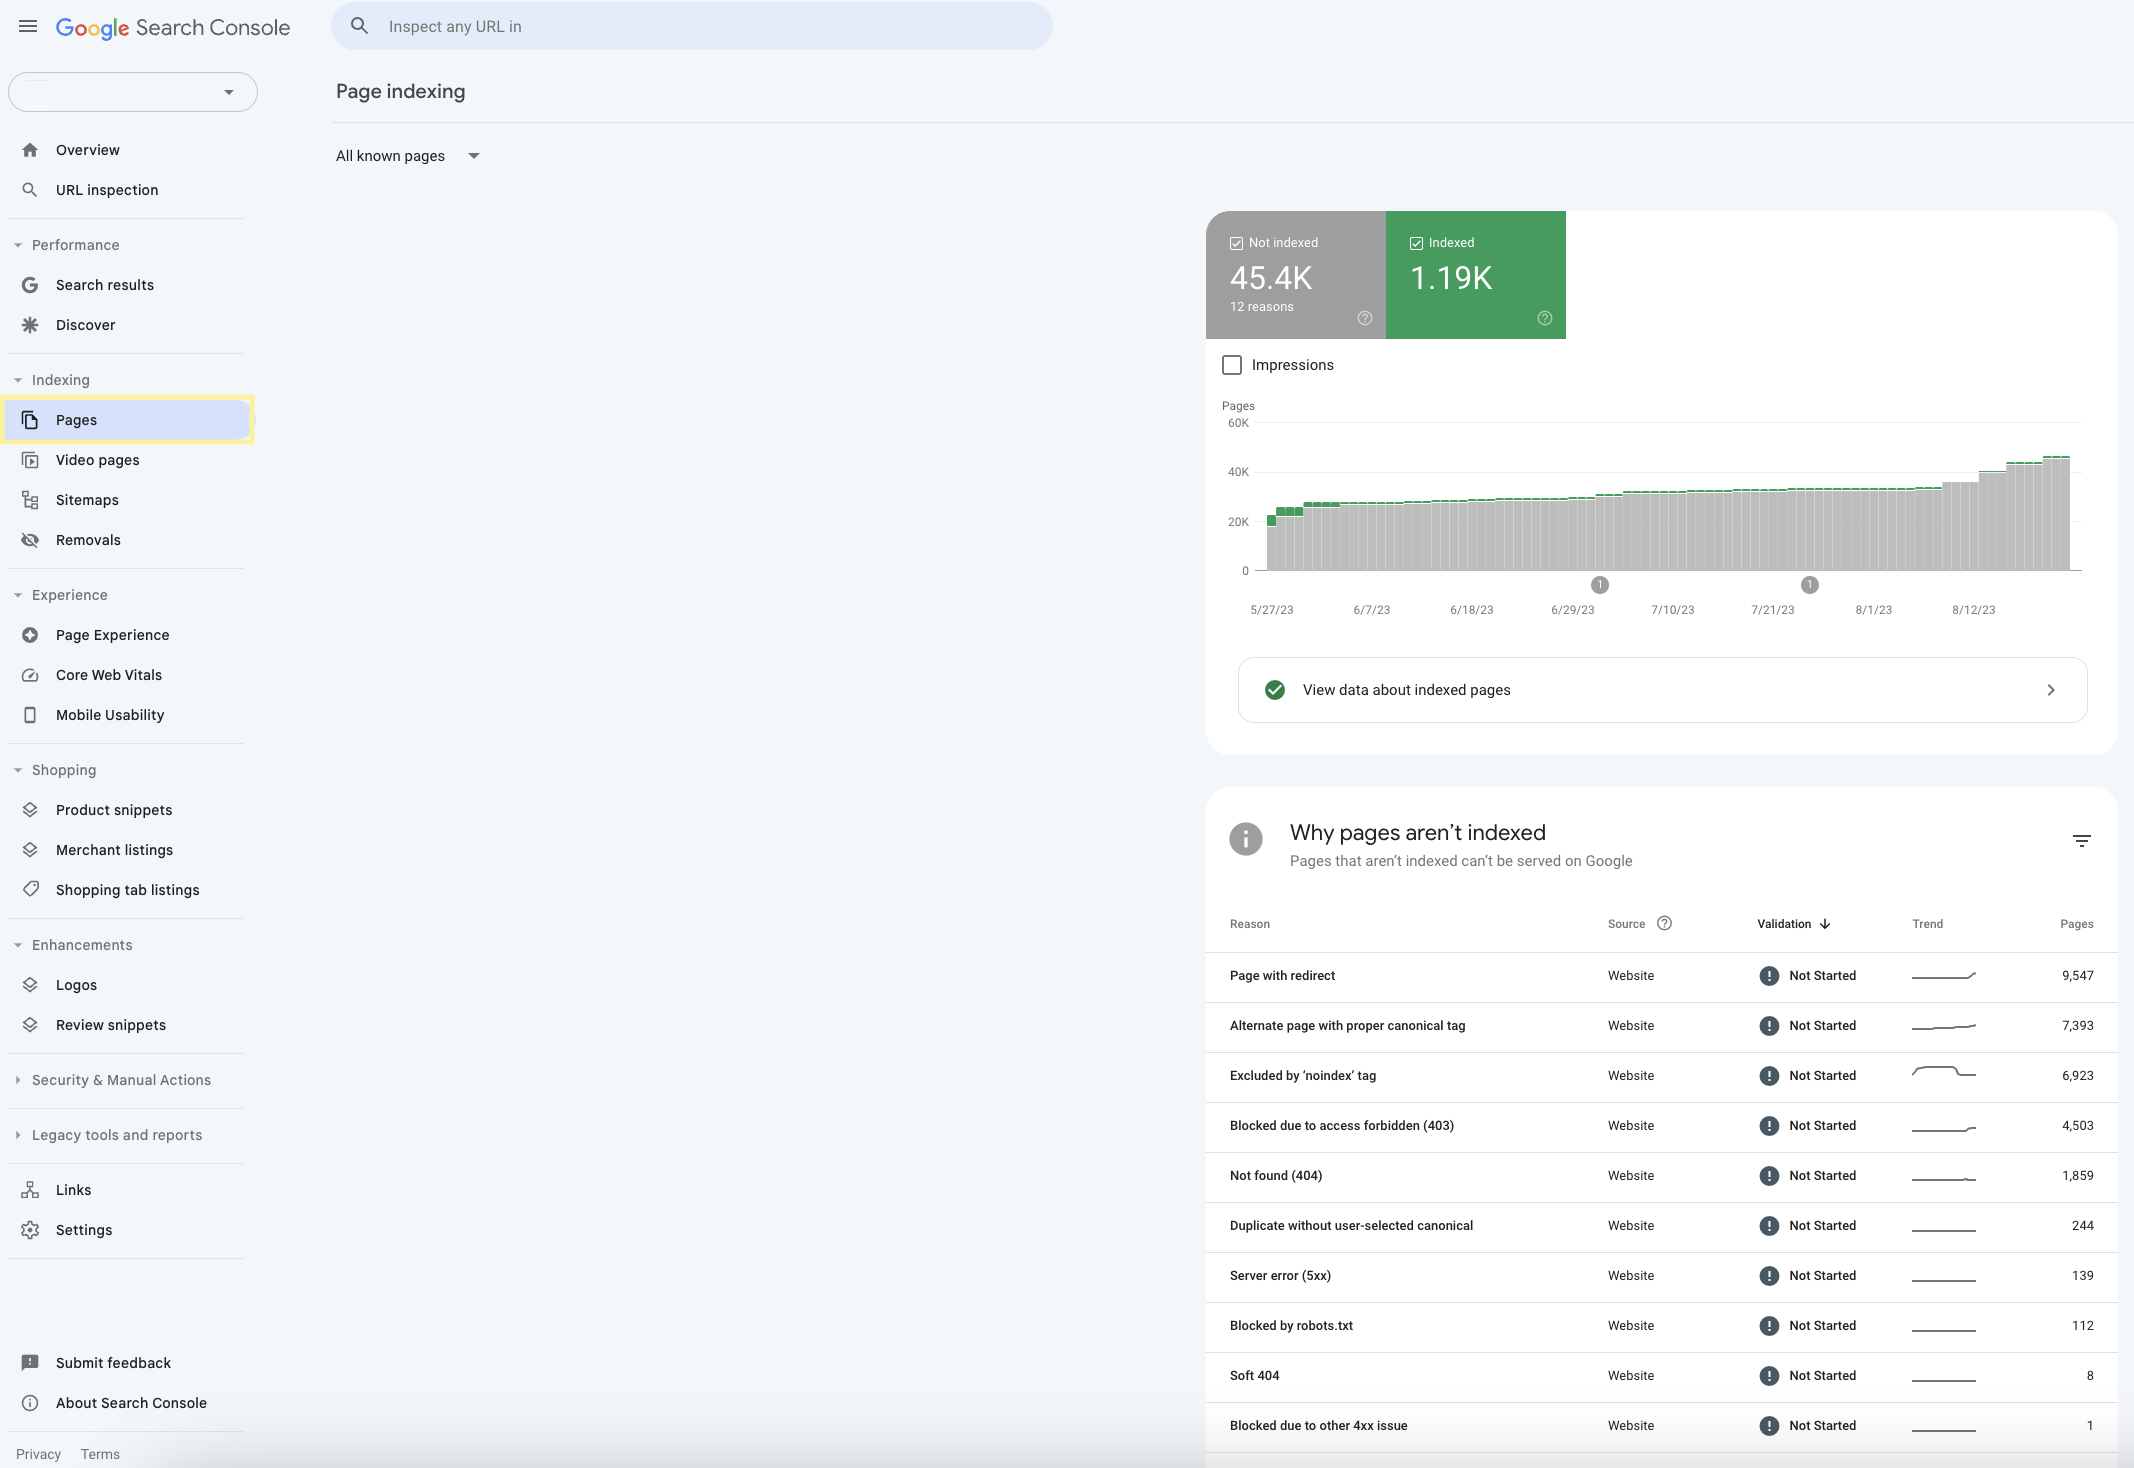
The indexation report, or coverage report, is the first cluster of technical reports in the GSC.
Under Pages, it provides an overview of the indexed pages of a domain. As long as a page is not indexed, it cannot rank in the Google SERP and thus cannot generate organic traffic. Consequently, it is important to check whether all desired pages have been included in the index by Google.
Figure 3: Screenshot of the Google Search Console for page indexing
The report not only provides an overview of how many pages were indexed and how many were not, but also lists below how many URLs were not indexed and for what reason. You can export the report via the button at the top right and correct the reported errors.
If, for example, 404 pages are displayed here, you should check how Google was able to find them. Look at both internal and external links as well as the sitemap.
Note here that it is perfectly normal that not all pages have been indexed. Some URLs are deliberately excluded from indexing by Noindex directive, robotos.txt or HTTP response header.
Recently, the GSC has also started to offer the feature of a video page indexing overview including optimisation suggestions.
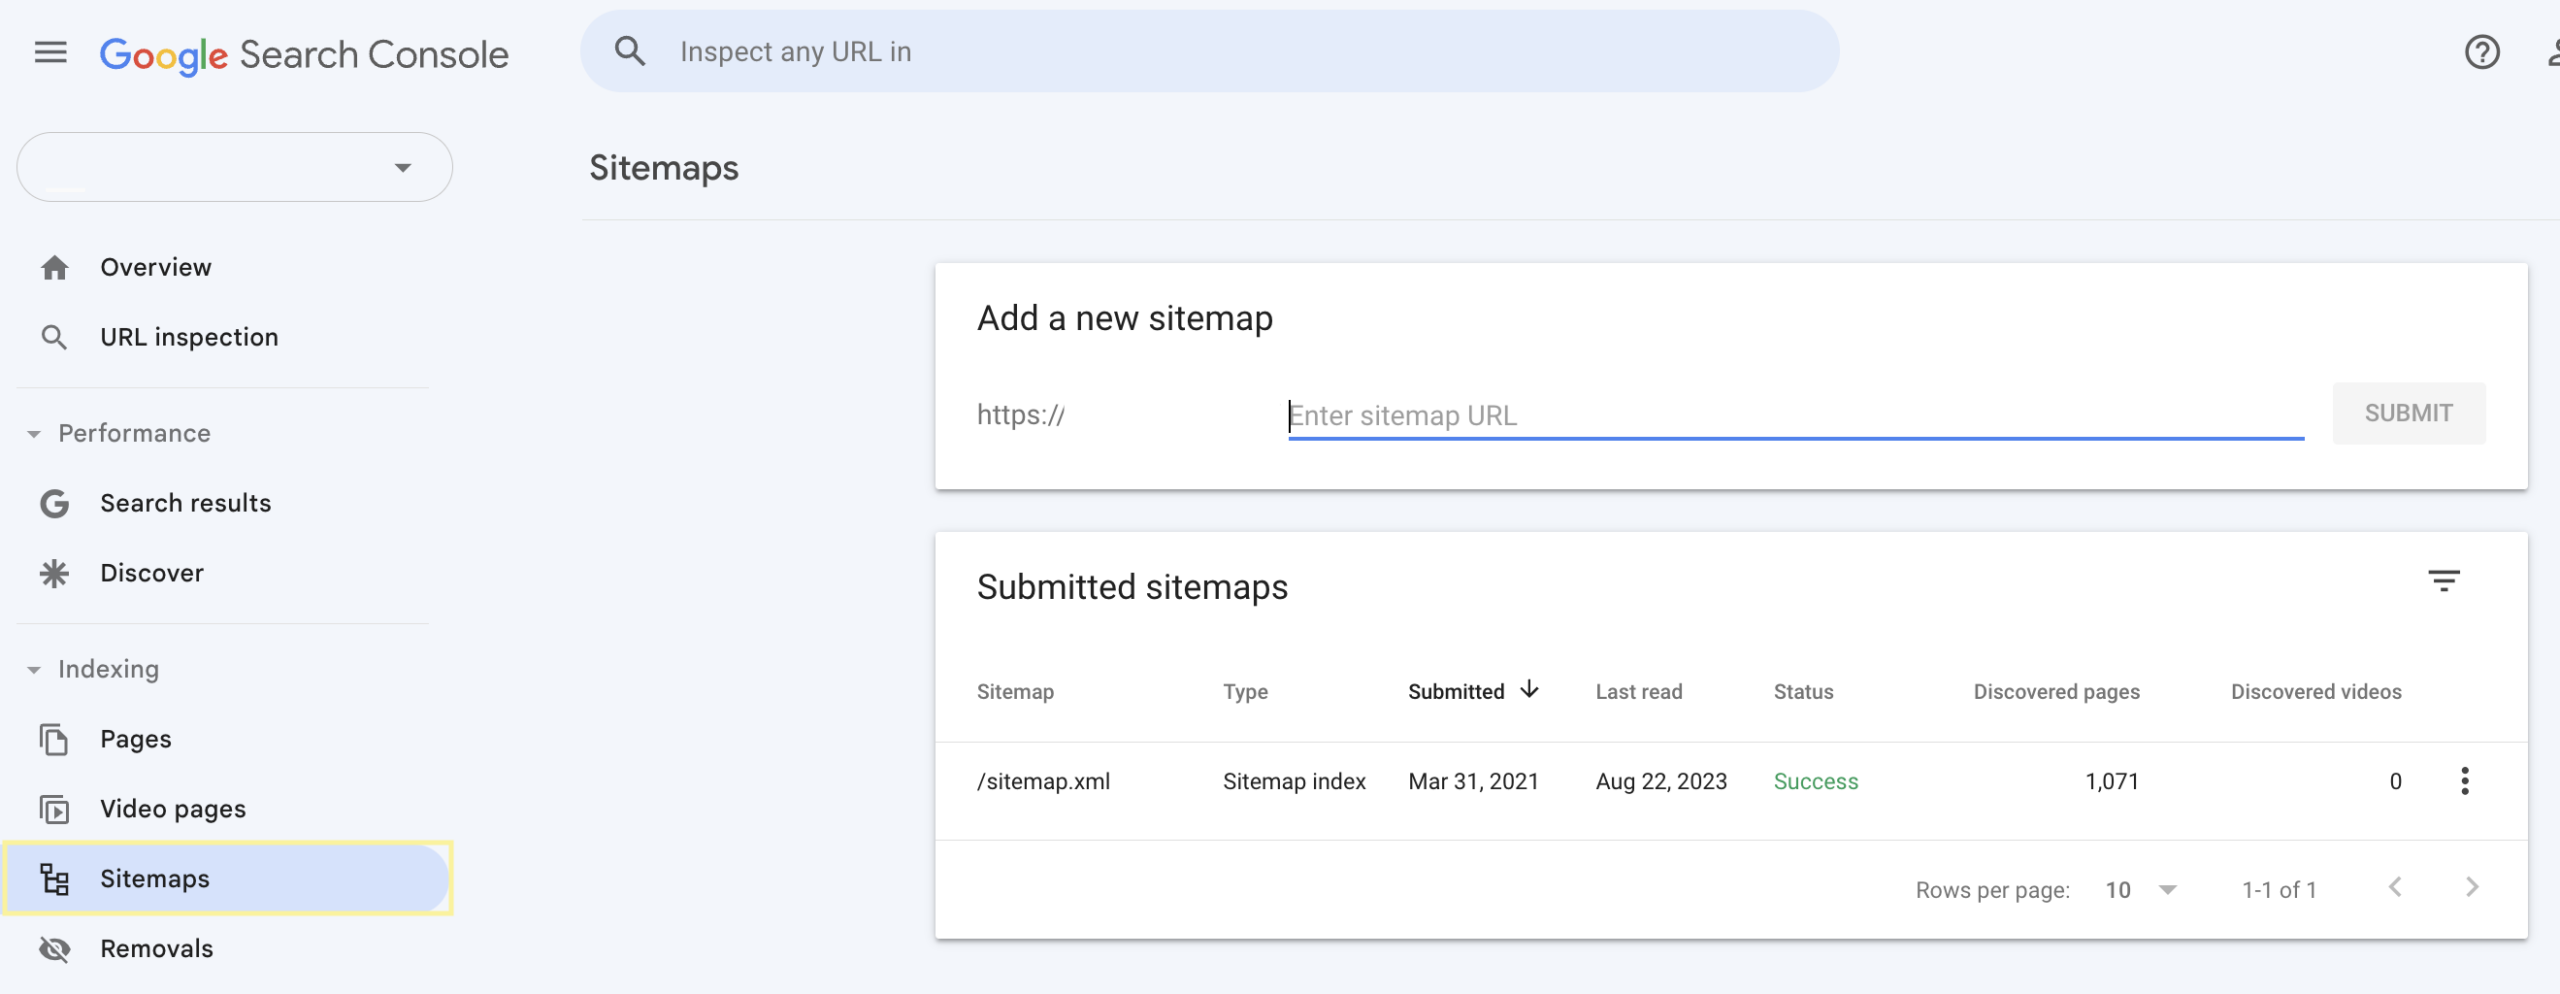
Sitemaps
Another important menu item of the Search Console is the report on submitted sitemaps. Especially for large domains, the submission of such an XML file is worthwhile, as it helps the bot to crawl, analyse and evaluate the domain efficiently.
Under Sitemaps you will find the information whether Google was able to process the submitted file and if not, where errors are located.
Figure 4: Screenshot of the Google Search Console Sitemaps overview
If you want to explicitly request the indexation of certain landing pages, e.g. because they were newly created, you can enter the URL in the search slot. The Search Console will then inform you that this page is not currently in the index, whereupon you can submit it manually.
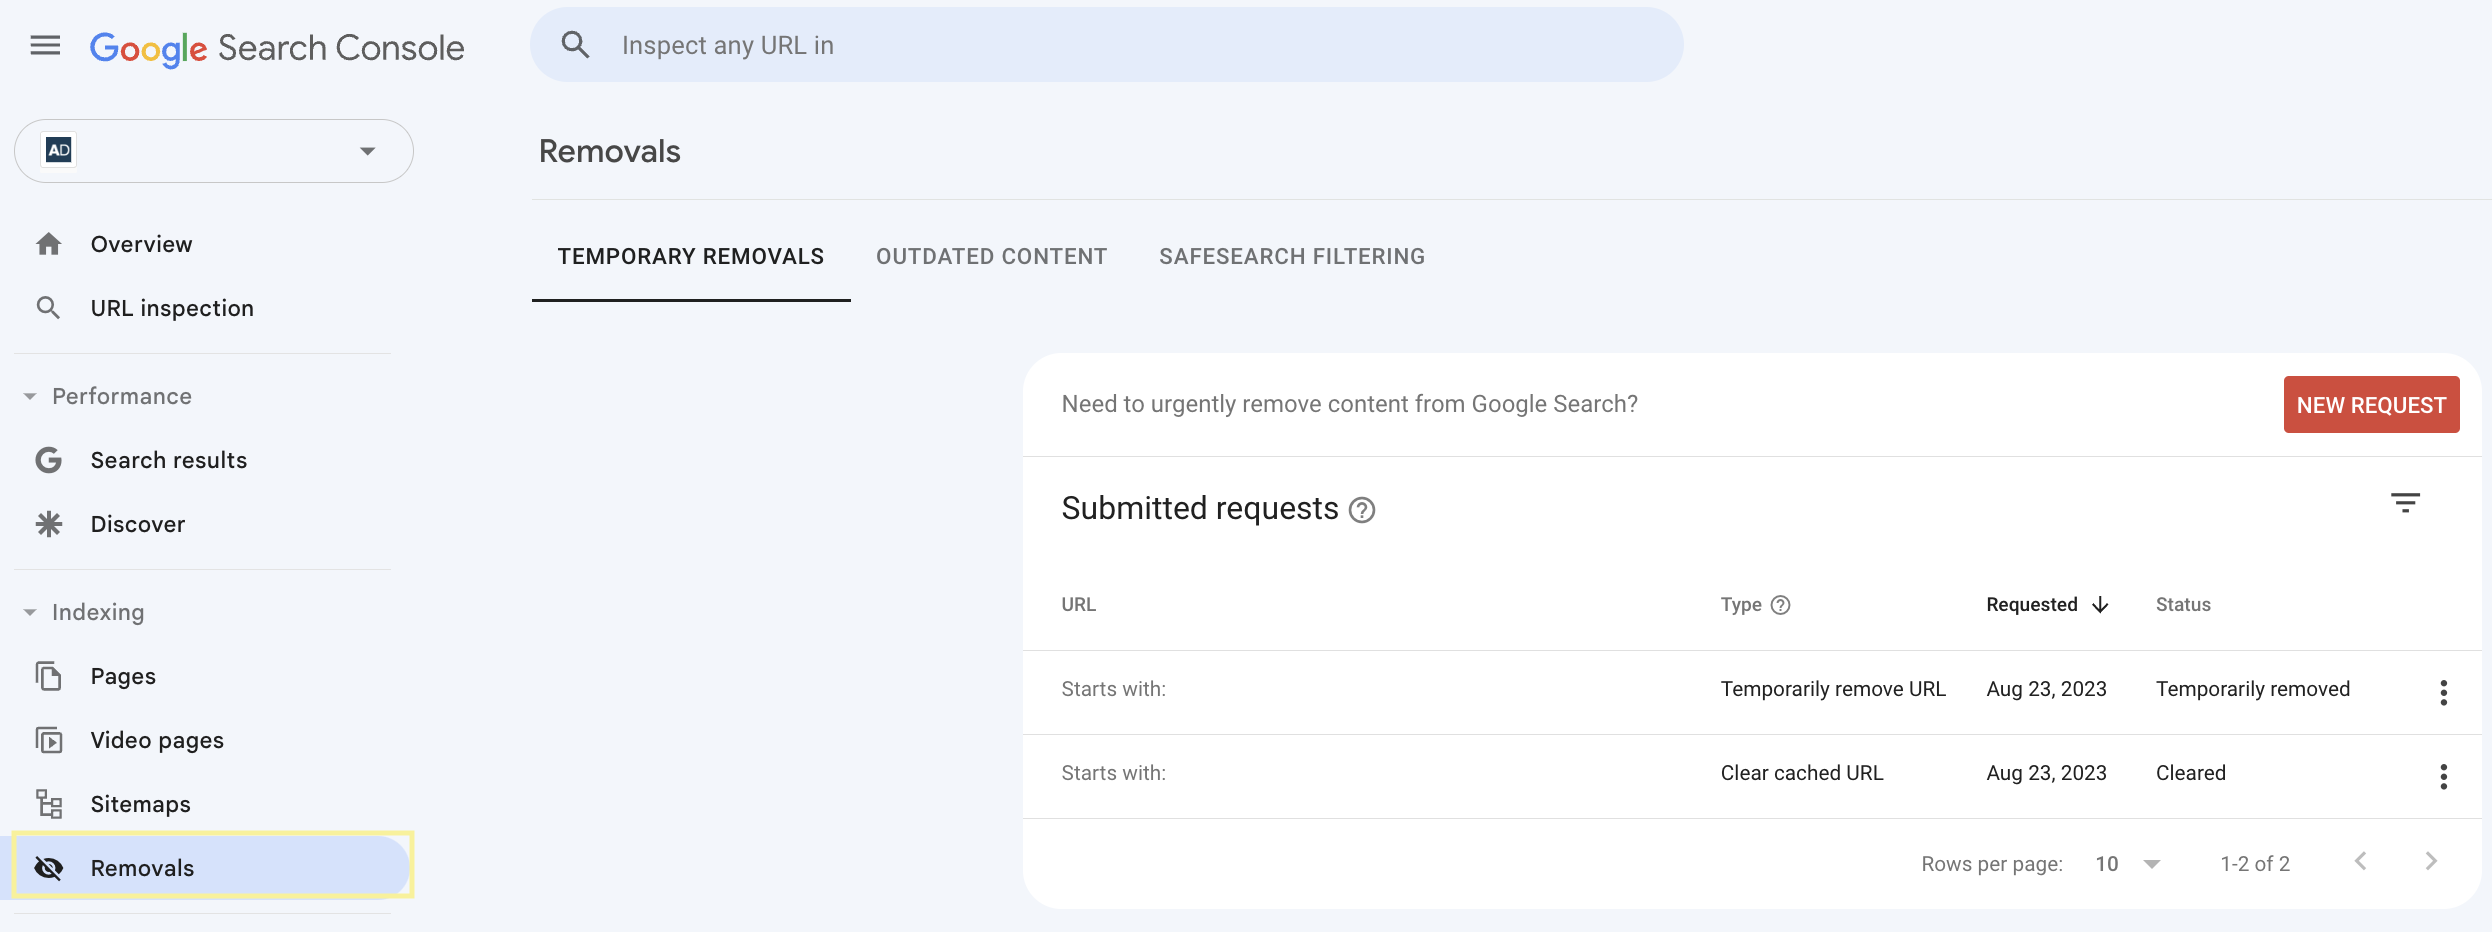
But the Search Console also offers a contact point for the opposite case. Namely, for the case that URLs are to be de-indexed. For example, if orphaned pages are to be deleted to slim down the domain, or if products have expired. For this purpose, users with unrestricted authorisation can submit a request with URLs to be de-indexed in the menu item Remove.
Figure 5: Screenshot of Google Search Console Remove URLs
Control mobile usability
The principle of mobile-first indexing should no longer be a new concept to anyone. Accordingly, a separate report is also provided for this within the Google Search Console.
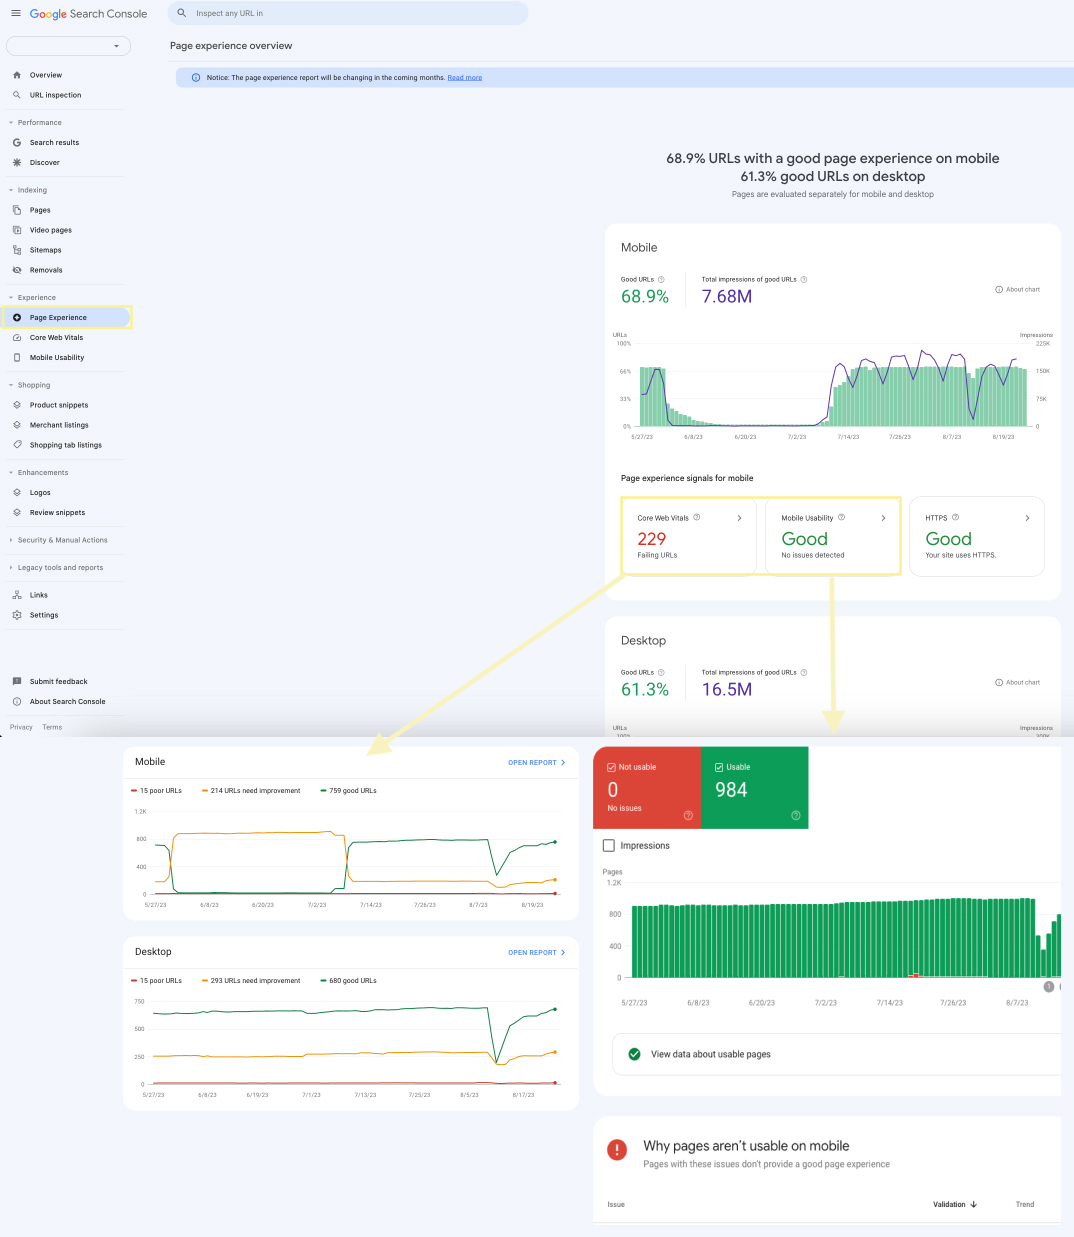
The tab Behaviour of pages gives an overview of how well the URLs have been optimised for mobile use in their entirety. The data is collected for both mobile and desktop devices. From this page you can also navigate to the tabs Core Web Vitals and User friendliness on mobile devices. There you will find which values do not meet the criteria and need to be optimised or where the user cannot interact optimally with the user interface due to the layout.
Figure 6: Screenshots of the reports under user friendliness
In particular, the Core Web Vitals have counted as well-known ranking factors since Google’s Page Experience Update, which was fully rolled out worldwide by September 2021. The messages should therefore not be treated as secondary.
Improvements to the structured data
Structured data is a type of metadata that helps search engines better understand the content of your website. This can lead to a better representation of your website in the form of rich snippets. These contain richer and more informative representations, which can lead to a higher click-through rate.
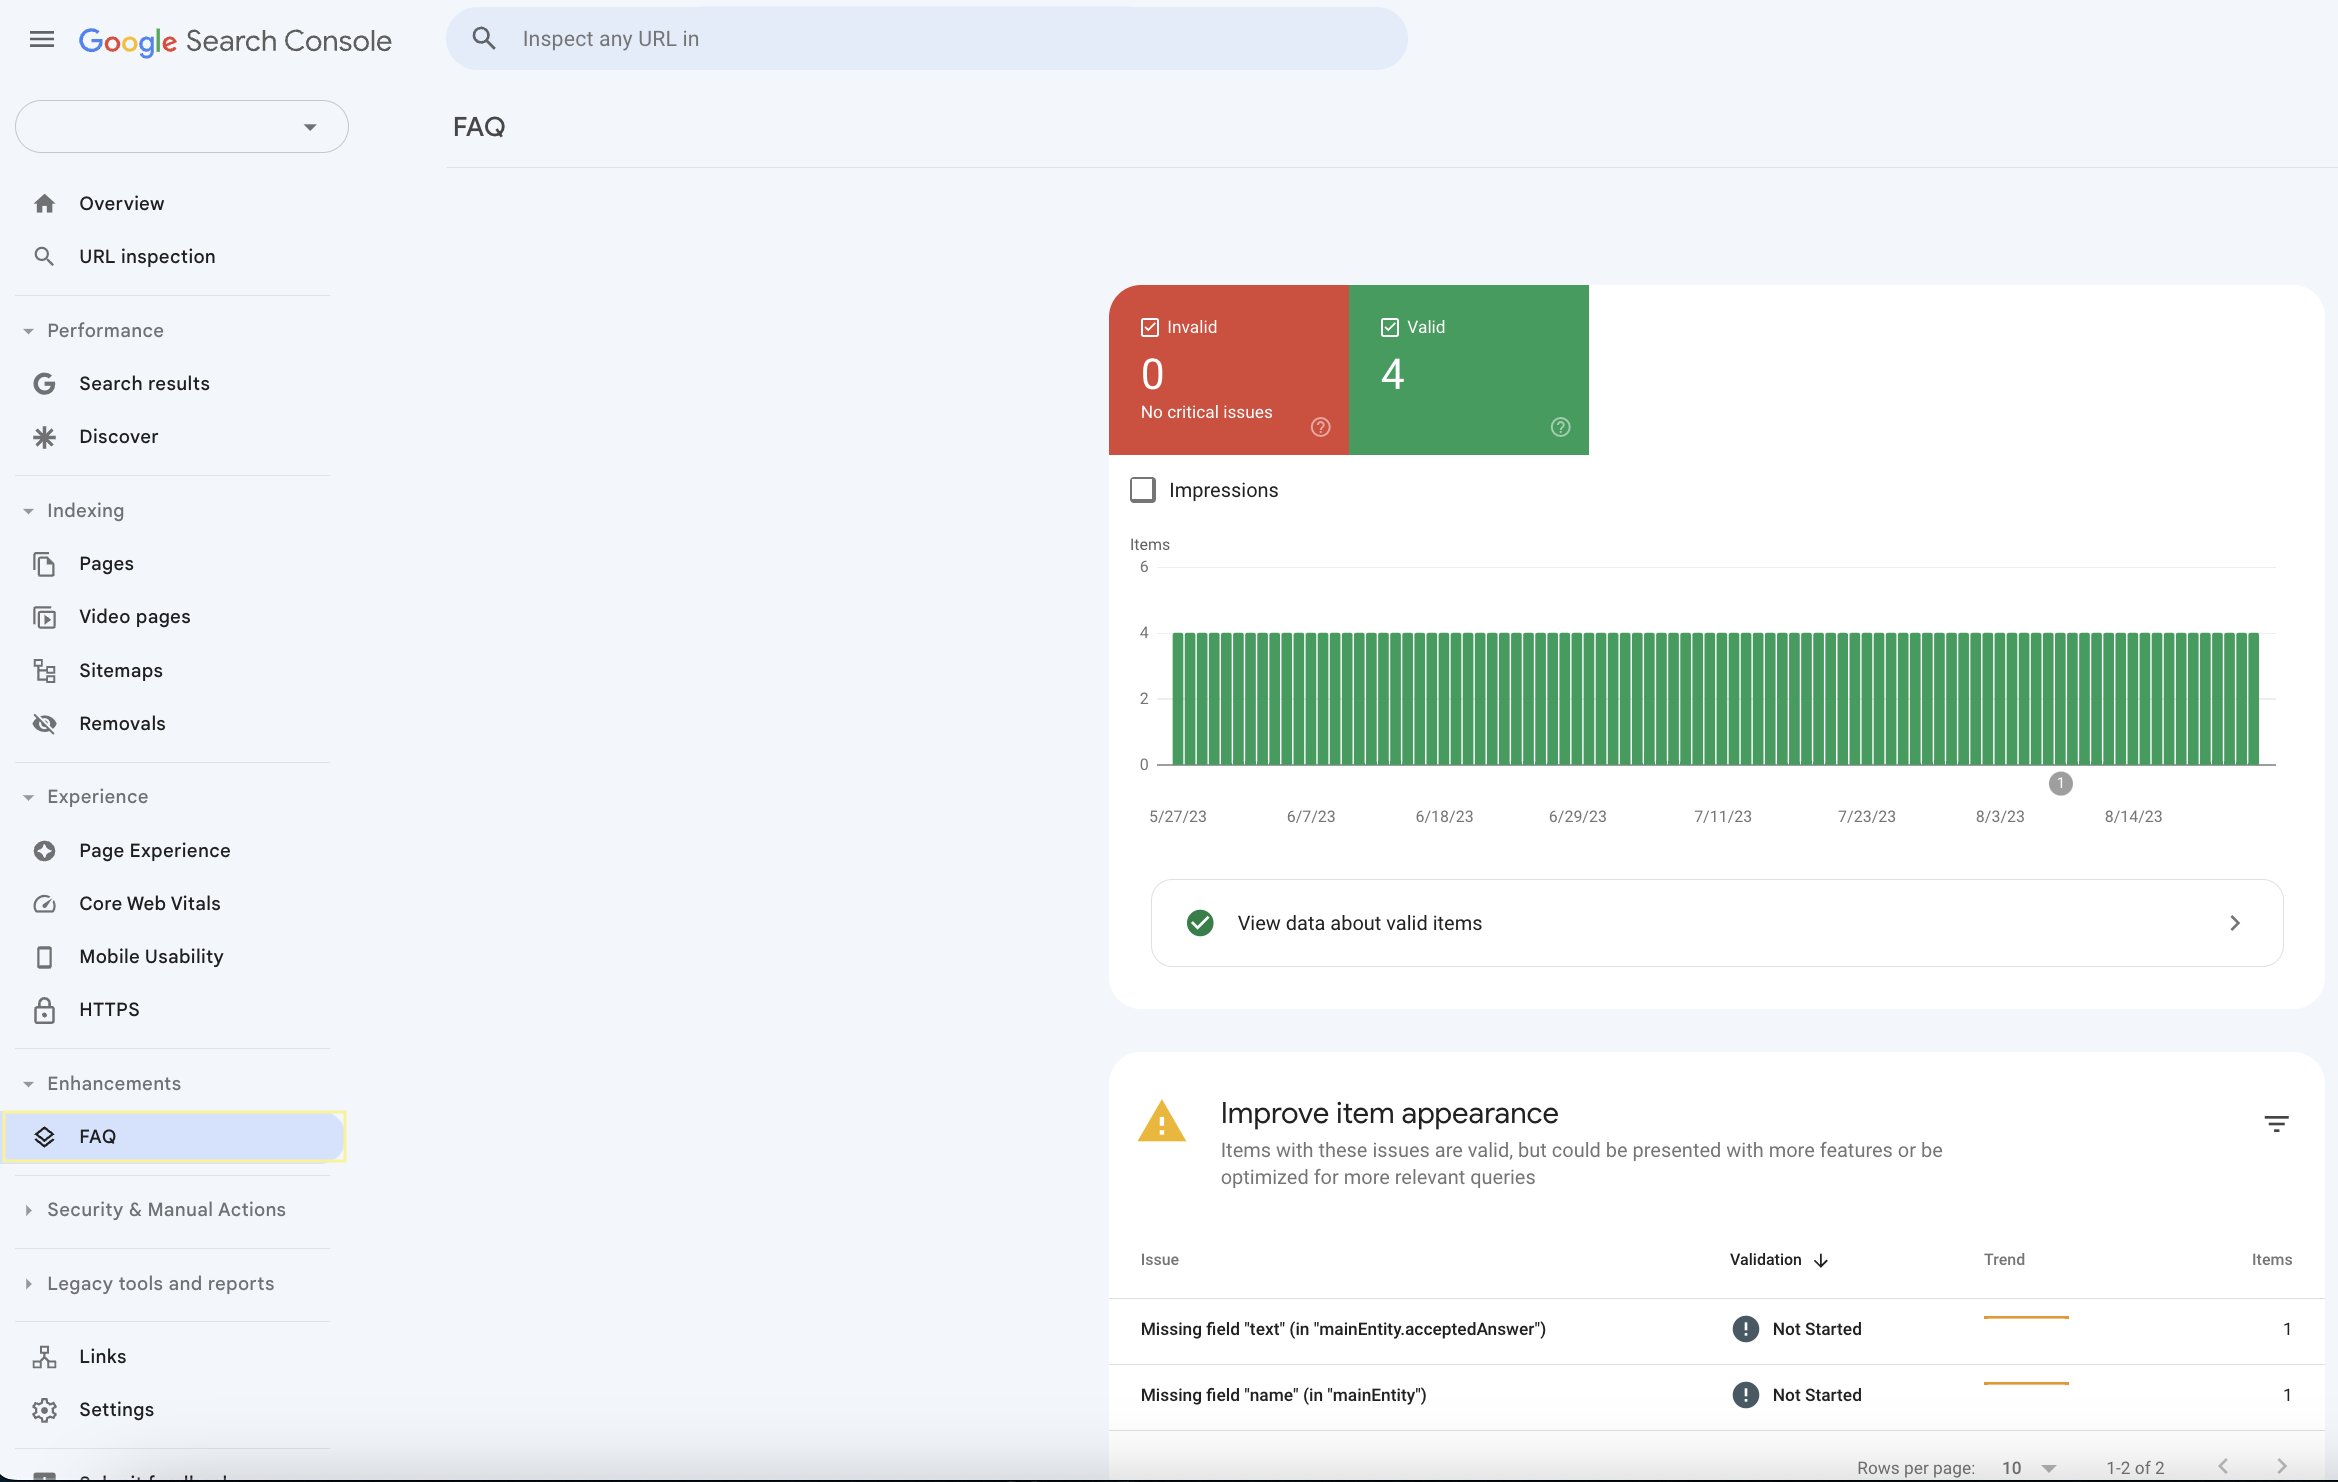
In order for this display to be considered, the stored schema must be correctly integrated. In the Google Search Console, there is therefore an extra report called Improvements.
Depending on which structured data is marked up on your website, different report components are displayed. This gives you concrete information on where the mark-up needs to be improved.
Figure 7: Screenshot of the FAQ mark-up report
If critical problems are displayed, it is essential to correct the award, otherwise no Rich Snippets will be played out. These messages are marked by Google in the report red and with an exclamation mark.
Security issues and manual measures
Especially in the case of sudden and unexpected traffic losses, you should check the Manual Measures and Security Problem menus for existing entries.
Manual measures by Google are usually taken when Google Webmaster Guidelines have been violated.
So, if you optimise your website without black hat methods, there is no basis for penalties and these reports will remain empty.
Small but nice link overview
Figure 8: Screenshot from the GSC for linking
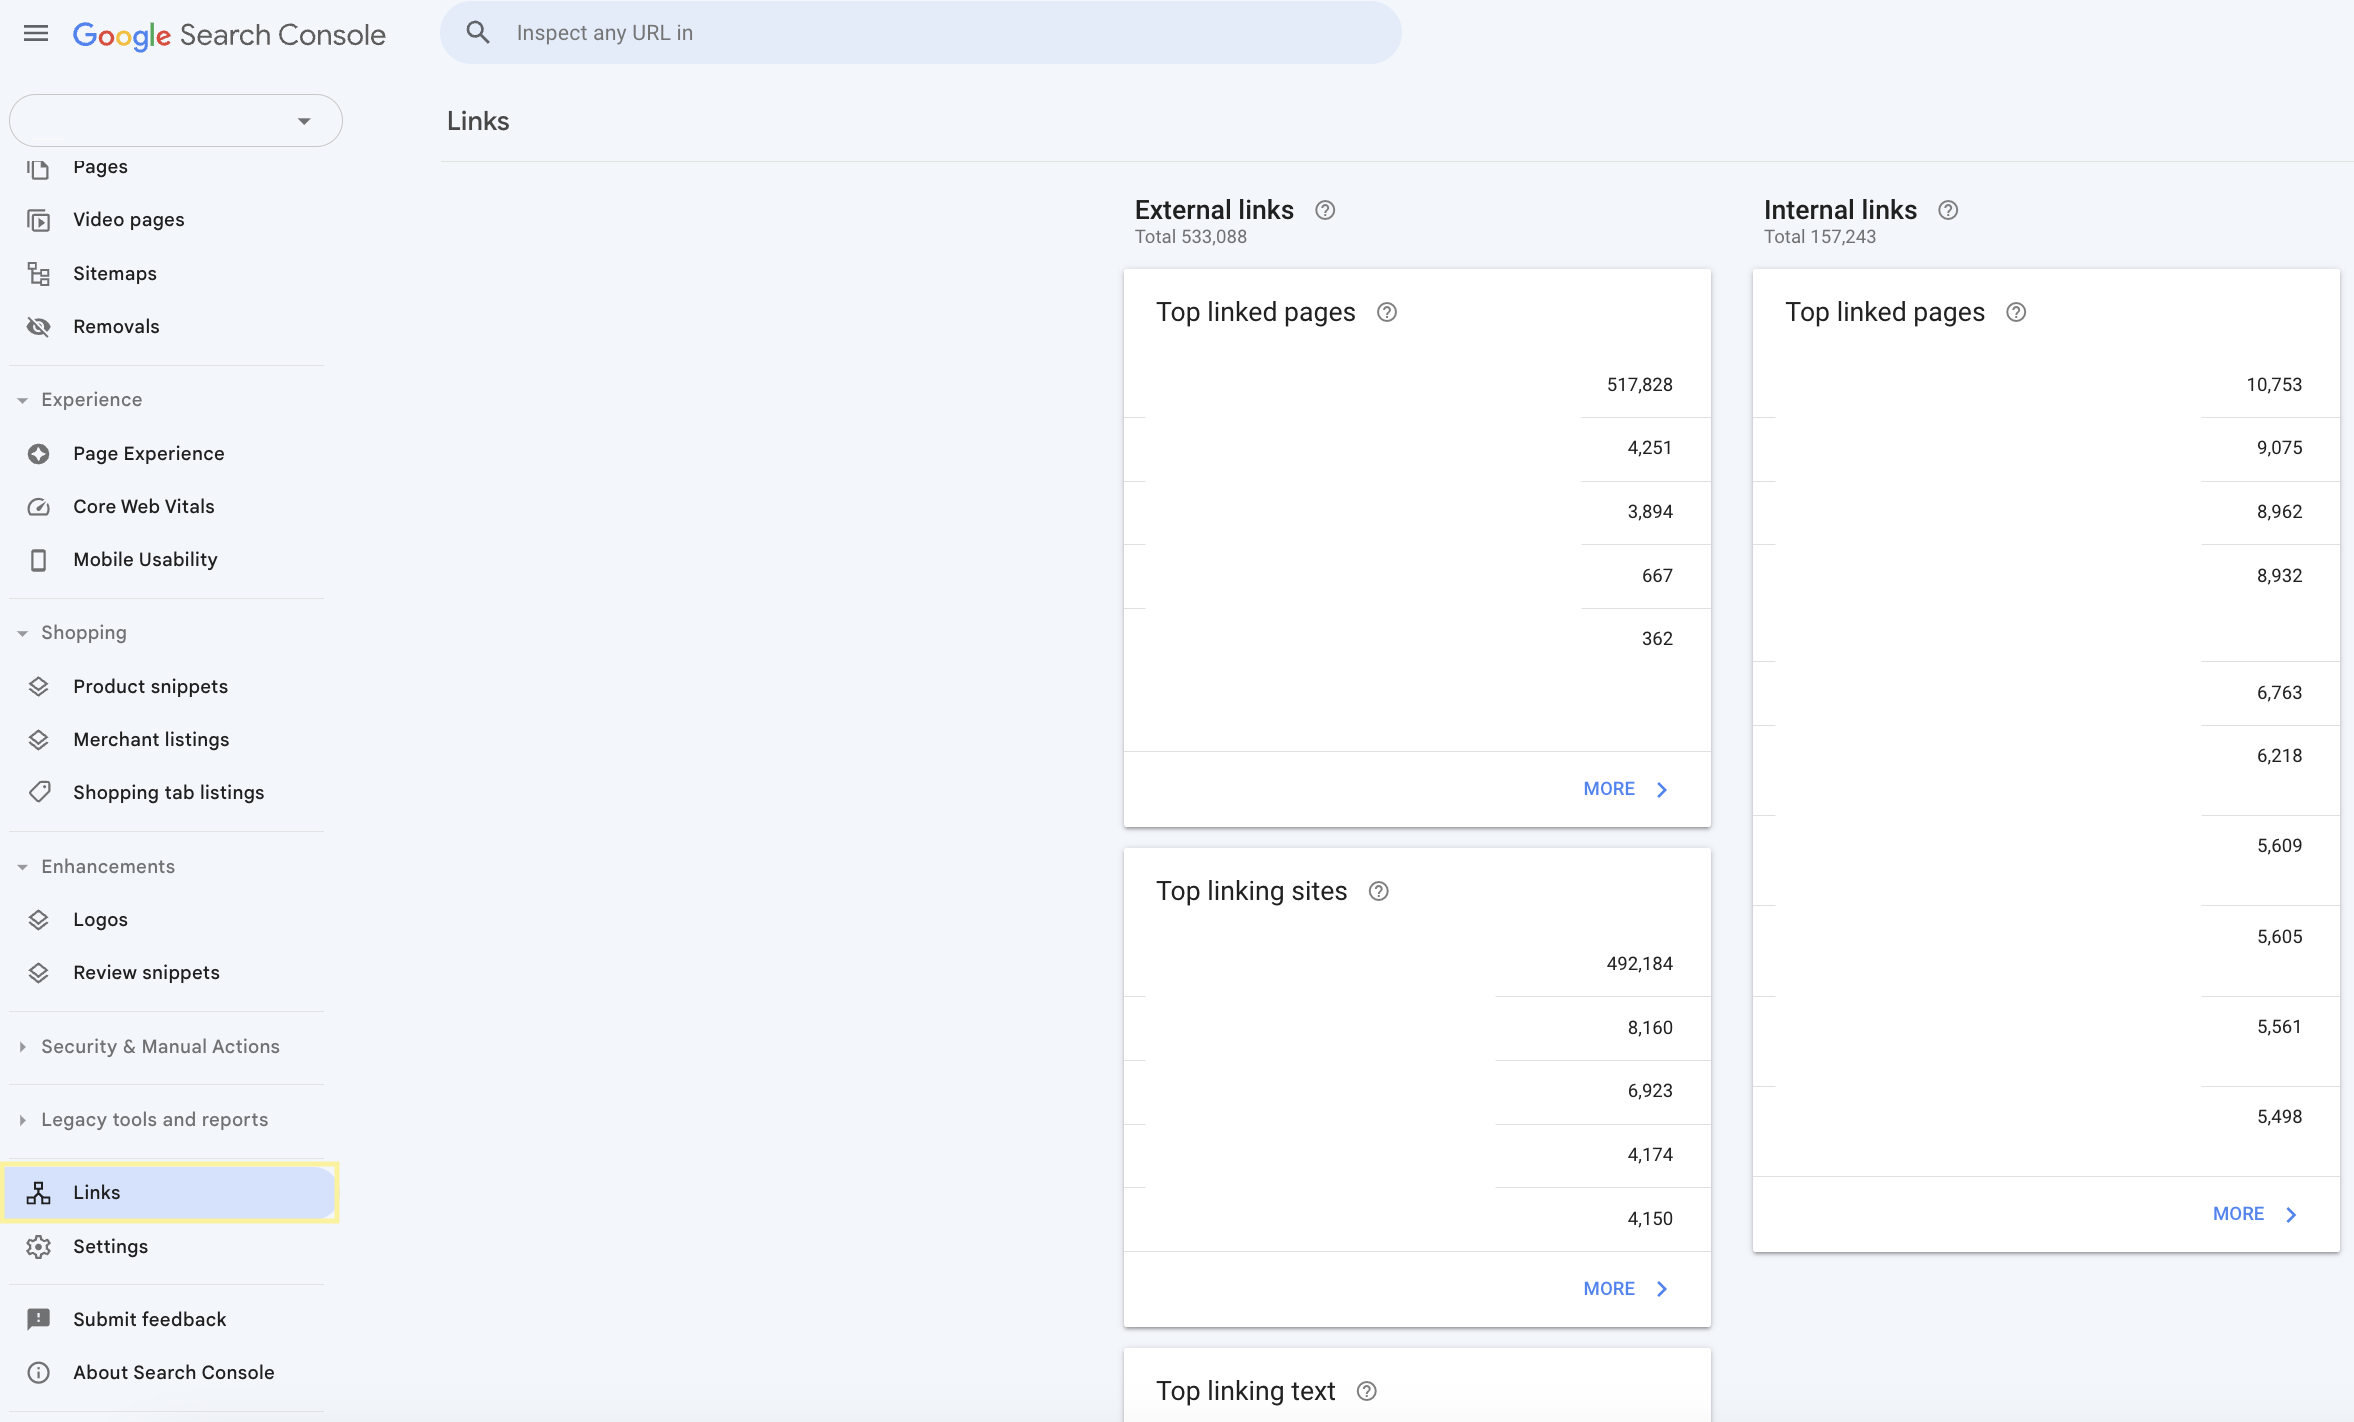
Last but not least, the link overview at the end of the menu should also be mentioned.
The most linked pages and the most popular anchor texts are displayed here.
But you have to be careful here! The external links do not come from other domains, but from other properties. If you work with URL prefix properties, links from other directories are called “external”, although they are on the same domain.
For a precise analysis of internal linking, this report offers a good starting point for an initial consideration. However, to be able to optimally improve the structure, tools such as Screaming Frog should be used.
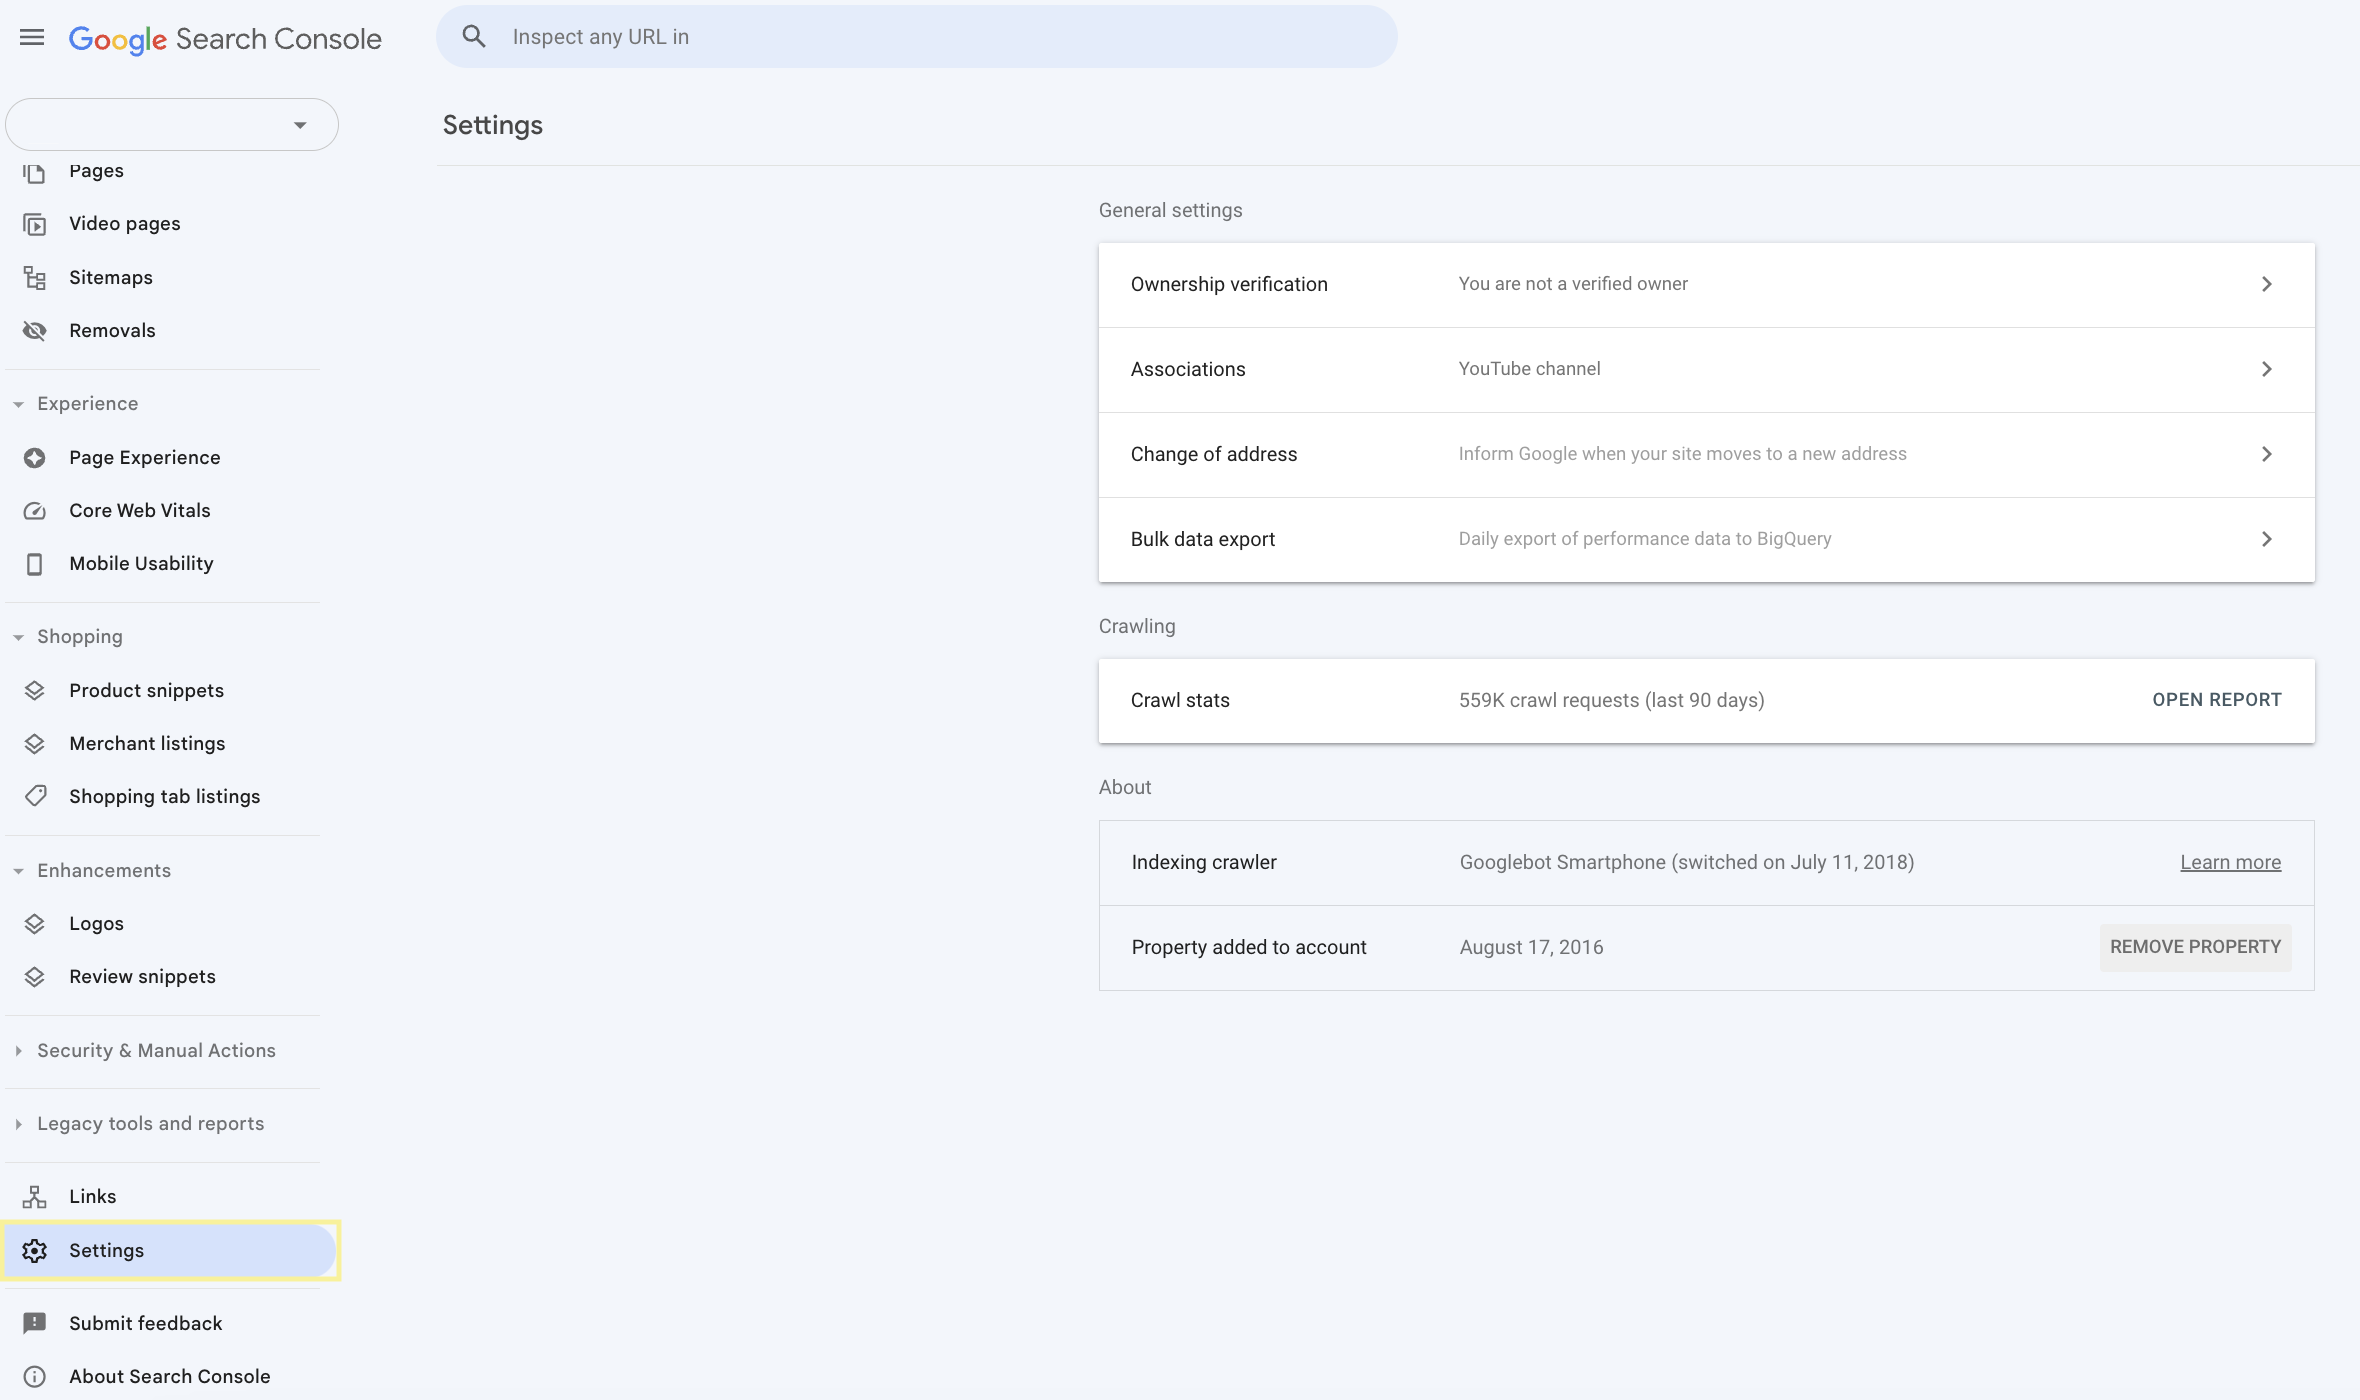
More settings
Finally, on the left edge of the menu items is the Settings item.
Here you can add further users to the property or, in the case of a domain change, set up a 301 forwarding to a new address.
In addition, an automated bulk data export can also be set up or other Google services can be linked together.
Figure 9: Screenshot from the Google Search Console settings menu
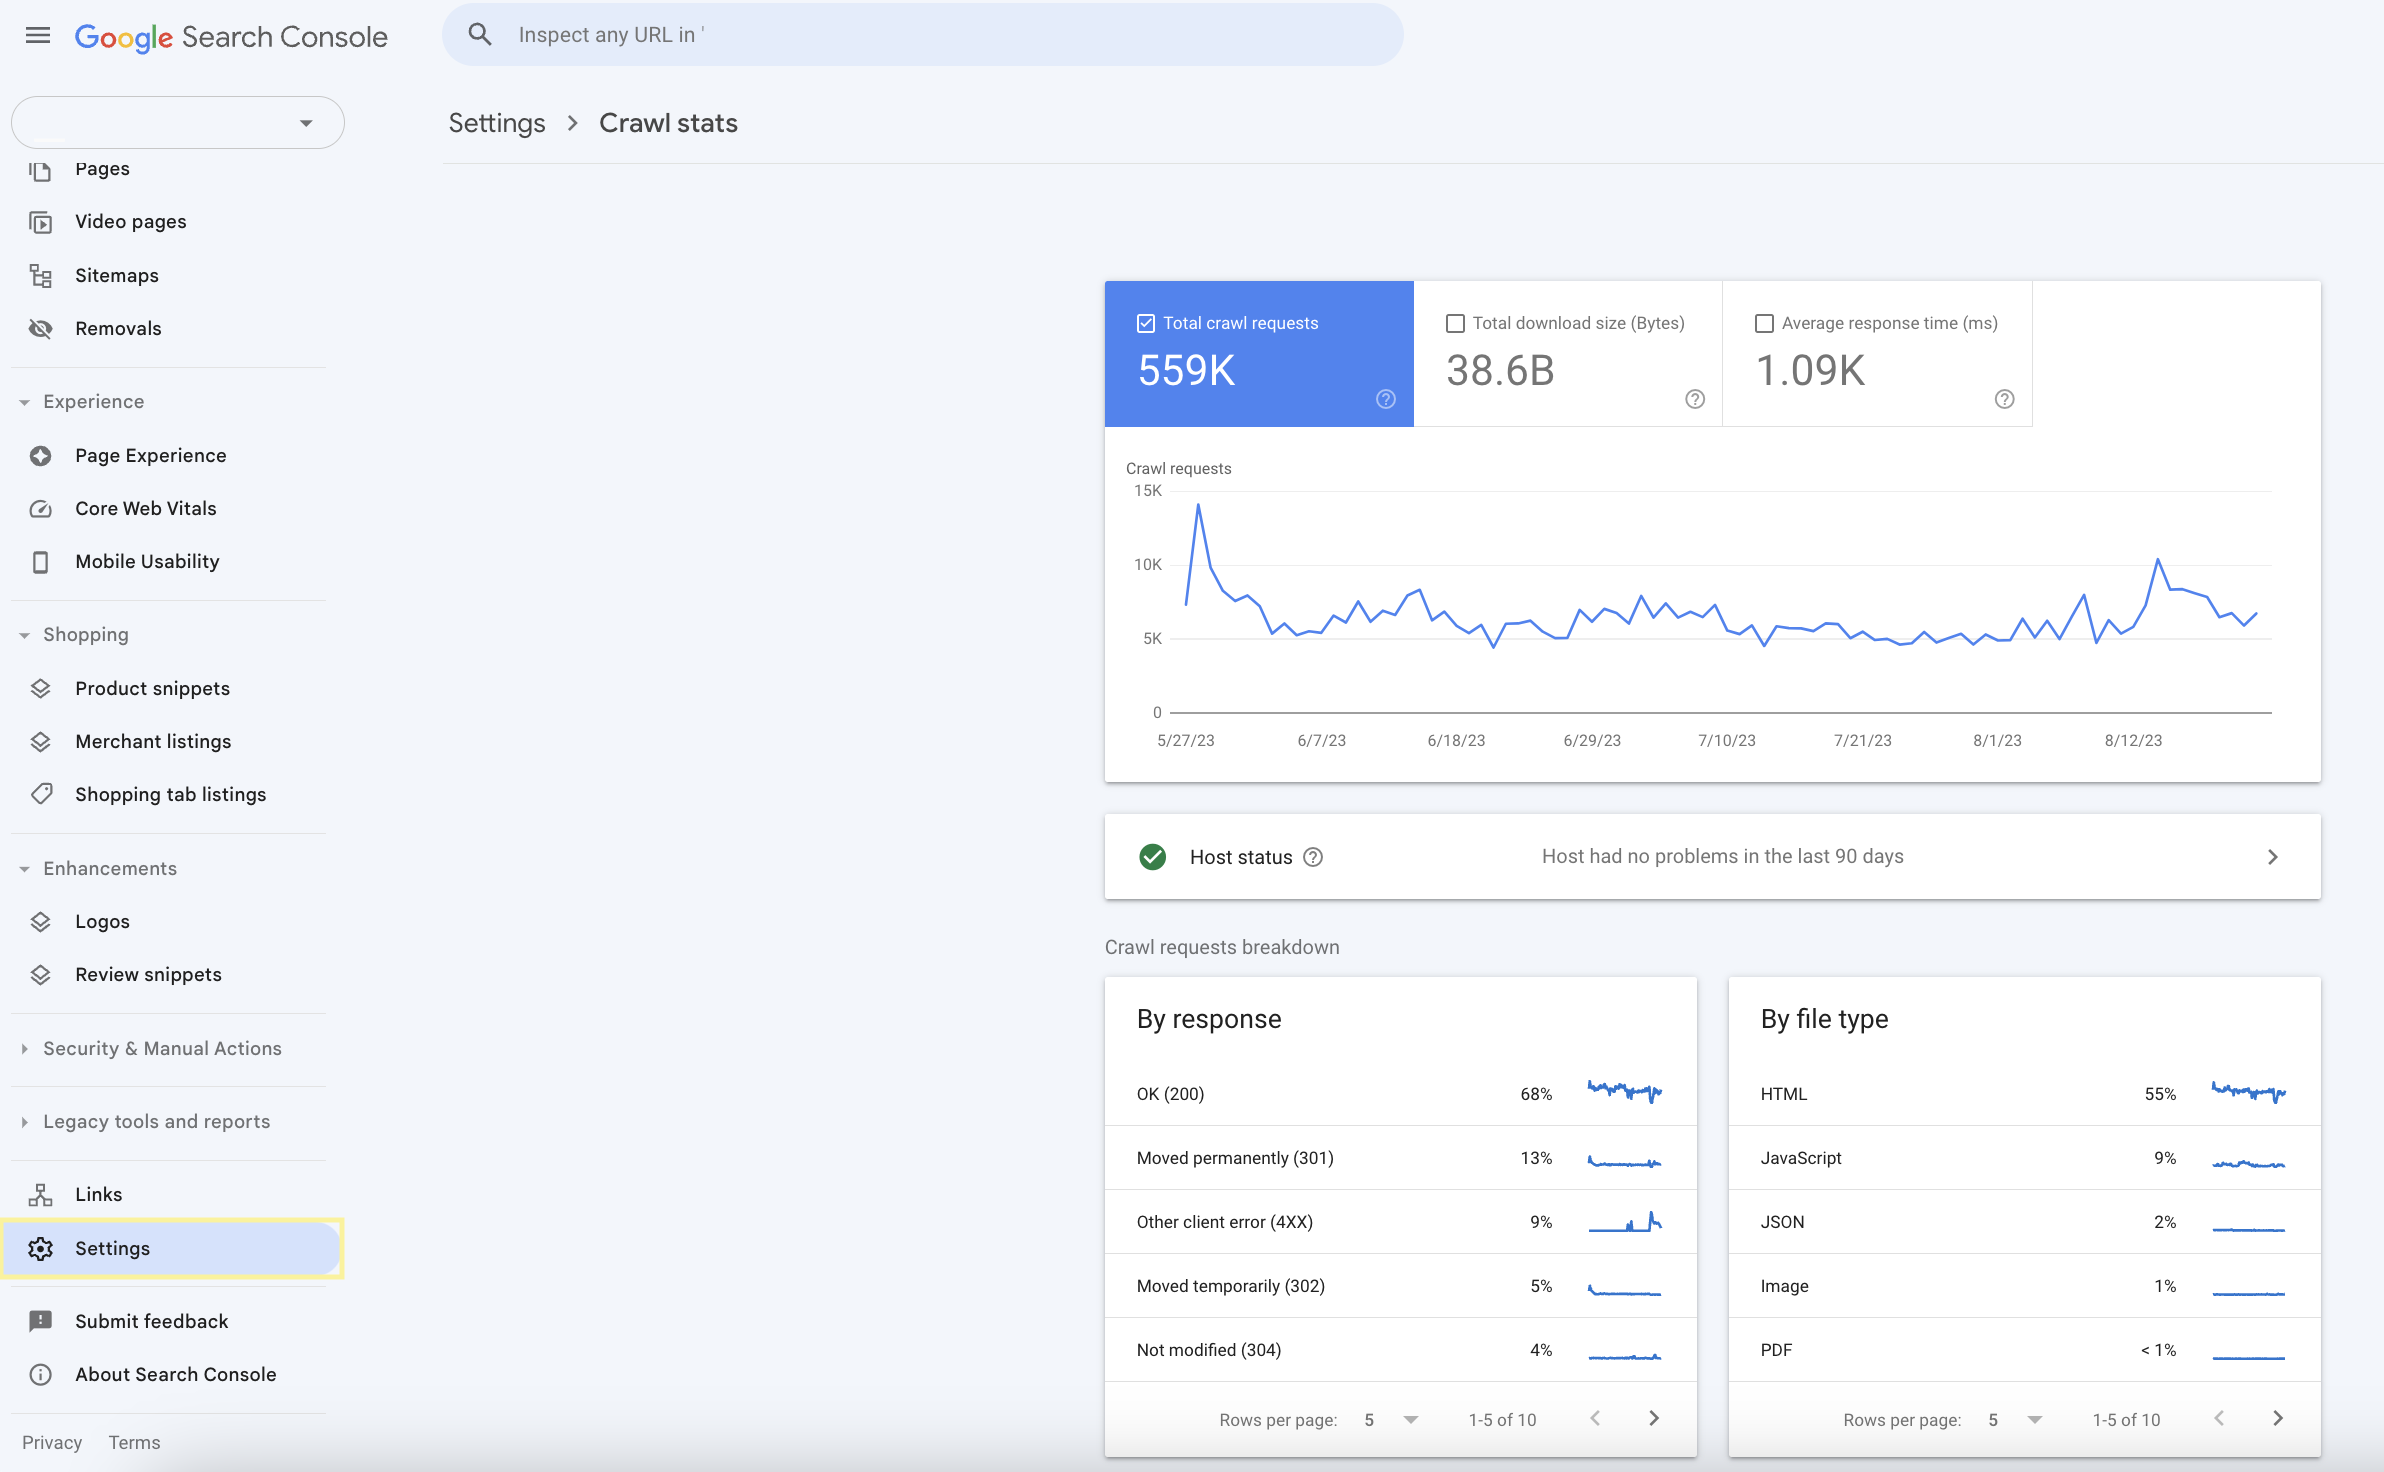
A menu item that is hidden here should also be checked as part of an optimisation and is therefore considered again separately. Reports on crawling statistics are somewhat inconveniently hidden and therefore difficult to find at first glance, but nevertheless important.
Figure 10: Screenshot from Google Search Console on crawling statistics
Can I also work with the data from the Google Search Console outside the tool?
The GSC also offers a number of links to other tools to provide additional information and data or to facilitate your analysis:
GA4: Here, SEO data and web analytics can be combined. This provides comprehensive insights into visitor behaviour.
Google Ads: Here, organic search data can be compared with paid search data, which simplifies the process of dovetailing the two marketing disciplines.
Google Search Console API: It enables automated access to the website data, allowing the data to be integrated into your own applications, tools and scripts.
How do Google Analytics and the GSC differ?
Google Analytics and Google Search Console are two separate tools that both offer valuable insights into the performance of a website. However, they differ in their functionalities and the data they collect:
Area
Analytics
GSC
Focus
Website traffic
Search result traffic
KPIs
Users and sessions, Interaction and Conversions
Clicks, impressions, CTR and position
Table 1: Focus of the Analytics and GSC tools
Our conclusion
Google Search Console is a powerful tool that provides website owners and online marketers with valuable insights into the performance of their website in search results. It makes it much easier to perform in-depth data-driven analysis to maximise visibility and traffic.
After successful setup, various reports are available that provide detailed information on search queries, performance data, indexing, mobile user experience and more.
Linking the Search Console with other tools such as Google Analytics and Google Ads enables comprehensive analysis and optimisation of website performance. Overall, the Google Search Console is an indispensable tool for anyone who wants to optimise their website effectively and be successful in the search results.
Need help improving the organic visibility of your website? Our SEO experts are happy to support you with data-driven analyses! 🎯
True to the motto "Be hard, work smart", Isabelle develops holistic strategies in her position as SEO & AI Search Expert. With a Bachelor of Science degree in e-commerce, which includes a focus on web management, she brings a solid education, which was complemented by her time as a working student at eology. Extensive experience in consulting for SEO and consideration in cross-channel marketing, allows her to help businesses maximize their visibility.
With our tips for the right OnPage optimization you can identify the optimization potential of your site and bring it up to date. Learn which adjustments and measures are important and the right ones for you. ... Continue readingWith OnPage optimization to success
If you want to grow your online business profitably over the long term, there’s one thing you can’t ignore: organic visibility. But SEO in e-commerce is about much more than just optimizing individual pages. In our practical guide, you’ll learn how to make your store search engine-friendly from the ground up! ... Continue readingThe practical guide to SEO for e-commerce
Are you looking for a tool to optimise your backlink and SEO strategy? Get to know LinkResearchTools (LRT), which offers you in-depth insights into your link profile and helps you identify harmful links and avoid potential Google penalties. ... Continue readingLinkResearchTools for backlink analysis and SEO optimisation
06 min
You want to learn more about how to optimize for search engines?