Rarely before has an algorithm change been announced by Google so early. But now it is getting closer: The Page Experience Update and the newly introduced Core Web Vitals. Have you already prepared your website well enough through search engine optimization to avoid being the loser? We will do the check with you!
Google Page Experience Update: What’s behind it?
Google has announced it for quite a long time: The Page Experience Update. It was introduced in June 2021. But what is behind it? The upcoming update rearranges the composition of ranking factors. One consequence of this may be a complete reordering of the search results. Google has a clear goal in mind: user-friendliness is to be improved, usability simplified and security increased. But that is not all. One buzzword comes up particularly frequently in connection with the Page Experience update: performance. Until now, this factor was difficult to measure. However, with the help of the Page Experience Update and the Core Web Vitals it contains, this is set to change.
Important update:
Google has announced that the rollout of the update will be pushed back a bit. Therefore, the Page Experience Update and the introduction of Core Web Vitals are not expected until mid-June, instead of May as announced at the beginning. It also follows that it won’t be completely live until around the end of August. The reason for the postponement: Google wants to give webmasters a little longer to fine-tune.
What does the ranking factor Page Experience represent?
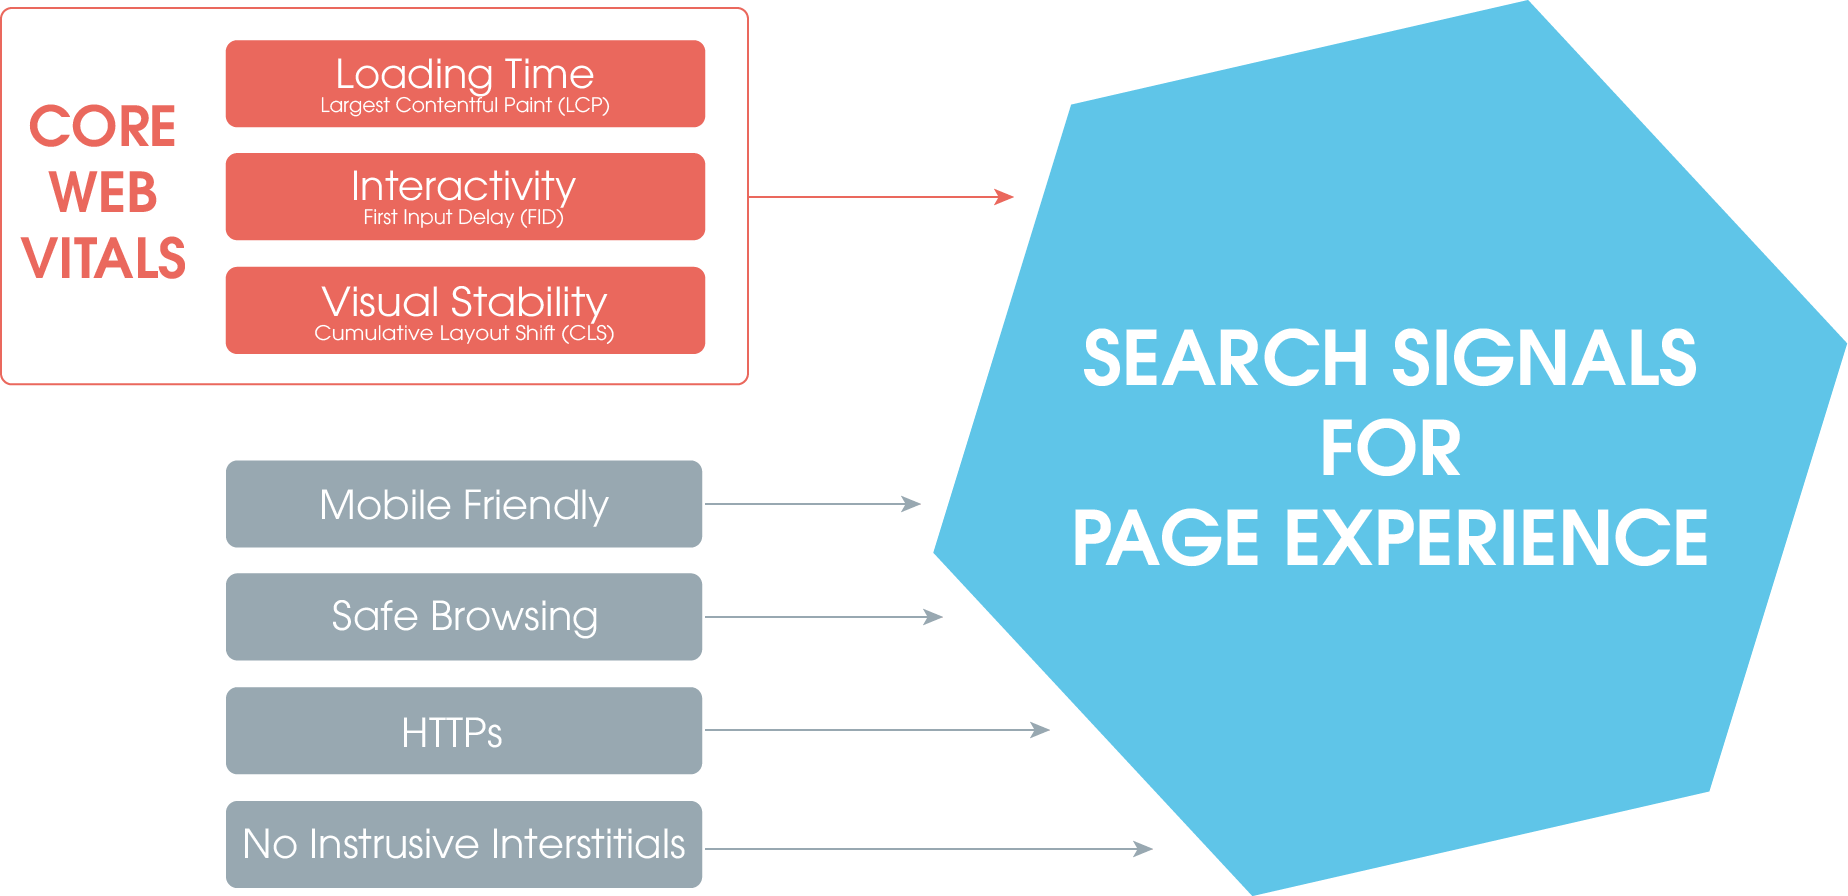
In detail: The Page Experience update is intended to help better map website performance. Google deals with the problem that the performance of different pages cannot be measured with the existing metrics. Performance is therefore (as of now) not clearly measurable. This makes search engine optimization more difficult. But this is supposed to change with the Page Experience update. The update includes these four already existing signals:
Mobile Friendly
HTTPs
Safe Browsing
No Intrusive Interstitials (no interrupting or intrusive banners, pop-ups, etc.)
But that’s not all. Originally, these metrics were supplemented by PageSpeed. This is where the Core Web Vitals come into play, making PageSpeed more tangible. The reason for this is that the components of the Web Vitals can be better documented and are easier to track. The metrics defined here are thus intended to make the performance of a website quantifiable.
Ranking factor Page Experience – This is how it is composed
It is not yet clear what the weighting of the individual components will be. What is certain, however, is that the four “old” key figures will be combined with the Core Web Vitals to form a new ranking factor – the Page Experience. This will therefore be particularly important for future search engine optimizations.
What are Core Web Vitals?
With the help of the Core Web Vitals, Google wants to create uniform quality signals. These are intended to quantify the user experience with a website in order to enable comparability and identify optimization potential. In this way, Google wants to improve the usability of websites on the web. Core Web Vitals, as a component of the page experience, will be a new ranking factor in the future. In plain language, this means: If you have understood the Core Web Vitals and optimized your website for the other areas of the Page Experience, you also have a good chance of better organic rankings.
How does Google measure Core Web Vitals?
To use the Core Web Vitals metrics, Google accesses two different sets of data:
Laboratory data (lab data)
Field data (also called real user monitoring, RUM)
The difference between the two data sets is easily explained. While field data comes from real users and their interactions with websites, lab data is collected under perfect and consistent circumstances. They show how potential visitors might experience and perceive your website. This in turn can lead to different end results depending on the dataset used.
Google’s statement on this is as follows:
„Field data is coming from real users, whereas lab data comes from a quite strong machine with probably good internet from somewhere around the world. So you might not see the same results.“
Google
Data
DATA BASIS
ADVANTAGES
DISADVANTAGES
LABOR DATA
Collected simulated data from potential users from a controlled environment with predefined circumstances (e.g., user’s device and network settings)
– Creation of reproducible results – Creation of a debugging environment – Better verification of the effects of optimization measures
– No recording of bottlenecks – No correlation with business or site KPIs – Target group and their behavior must be understood in order to interpret data correctly
FIELD DATA
Collected real data from real users’ experiences with real websites
– Capture of real actual conditions incl. bottlenecks – Correlation with business and site KPIs – Ranking relevant data
– Restricted key figures – Limited debugging function
Table 1: Laboratory data vs. field data in overview
The reason why Google uses different data sets is simple: The actual performance can be influenced by parameters such as the end device or the network connection of the website visitor. However, in order to be able to assess the performance of the page as accurately as possible, laboratory data is also used in addition to the field data of real users.
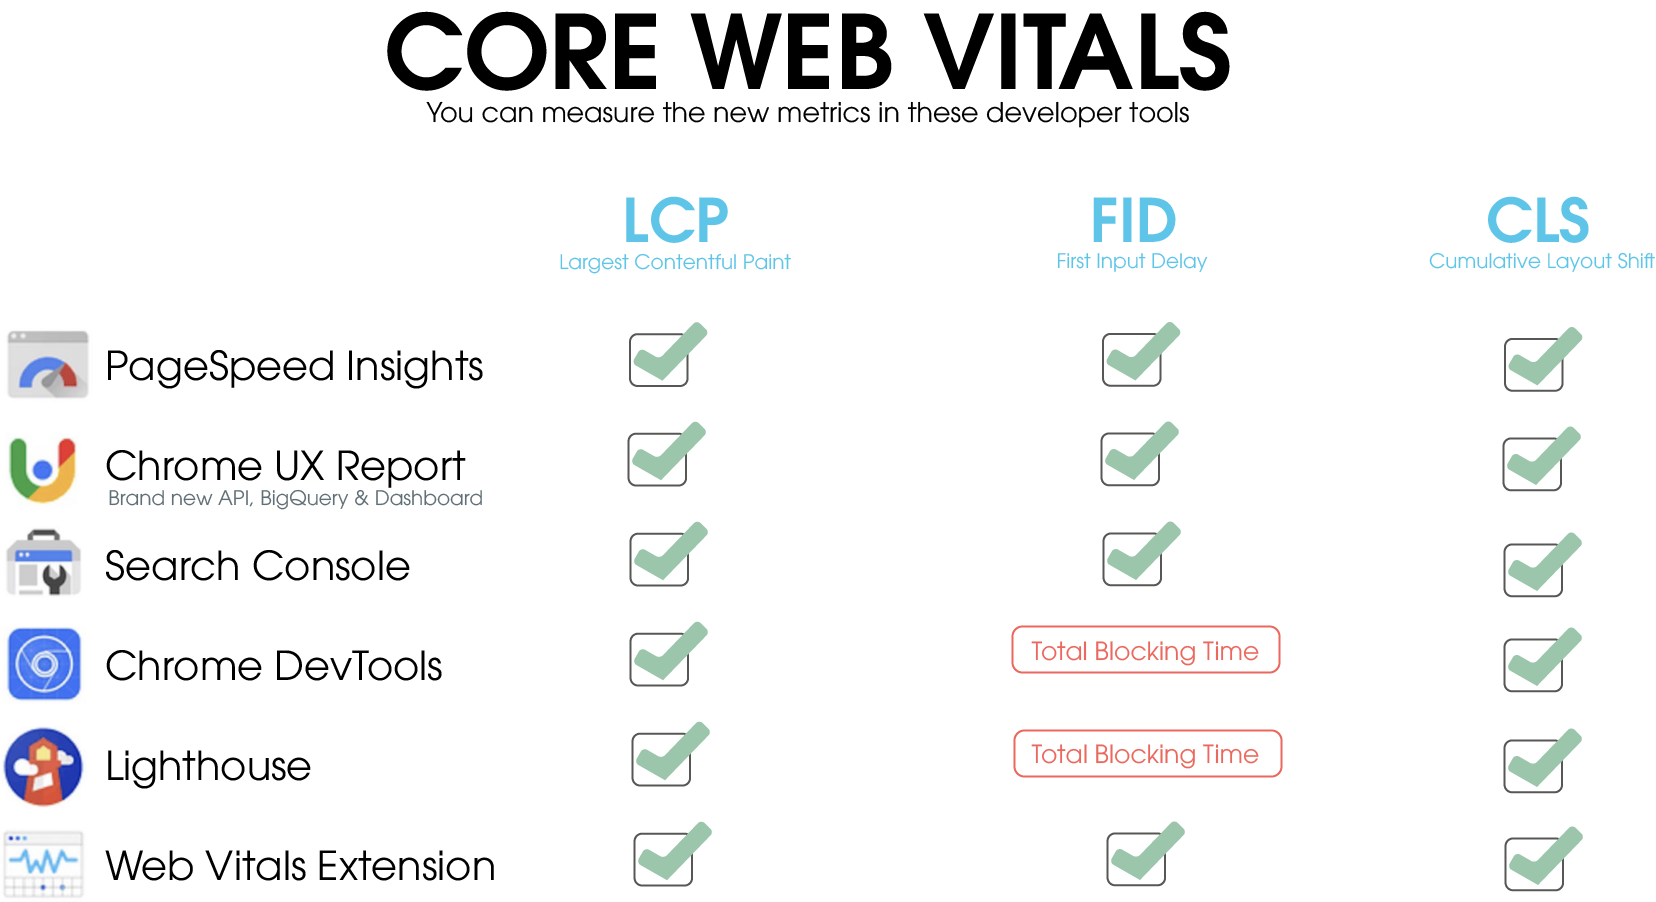
Which tools are suitable for the analysis of Core Web Vitals?
But it’s not necessarily important for you to know how Google collects the data. Instead, you want to know how you can measure the metrics yourself. Google has already done good preparatory work for this in 2020. The in-house tools are mostly prepared for the Page Experience update. For this reason, measurements of the Core Web Vitals are already possible via all popular Google tools. The following overview helps you to find the right tool for the appropriate metric:
Overview of Developer Tools for Measuring Core Web Vitals
The tools are also divided into lab tools and field tools. Lighthouse, for example, uses lab data, while the Chrome UX Report is based on field data. PageSpeed Insights, on the other hand, uses both.
Chrome UX Report
Even though the Chrome User Experience Report is not a real tool, but rather a data source, it is important for Core Web Vitals. It shows you what the user experience of real, anonymized Chrome users is like with different websites. Meanwhile, Google has also added Core Web Vitals here, as it is the new benchmark for evaluating user experience. The UX Report uses aggregated data, which you can view via the following tools:
PageSpeed Insights
The public Google BigQuery project
CrUX Dashboard in Google Data Studio
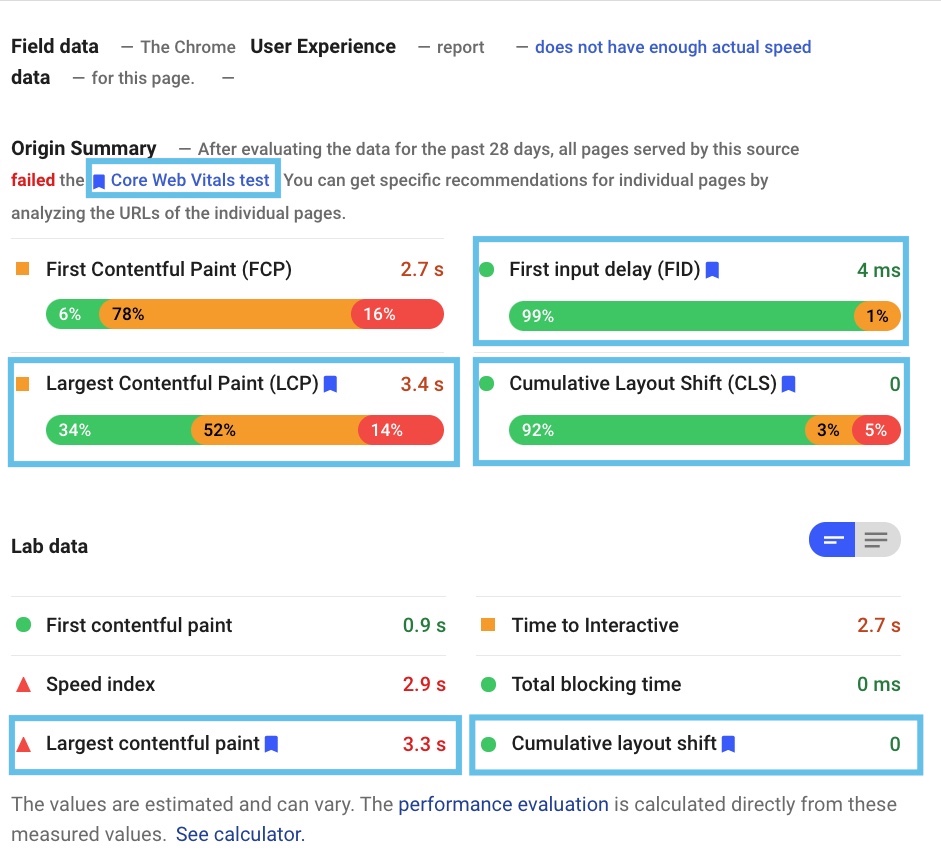
PageSpeed Insights
Until now, you could always test the performance of a website with PageSpeed Insights. The tool distinguishes between performance on mobile and desktop devices and gives you clear optimization recommendations. A blue flag has been added for the Core Web Vitals. This means that tool users can see directly which measured values are important for this.
Core Web Vitals (marked in blue) in PageSpeed Insights tool
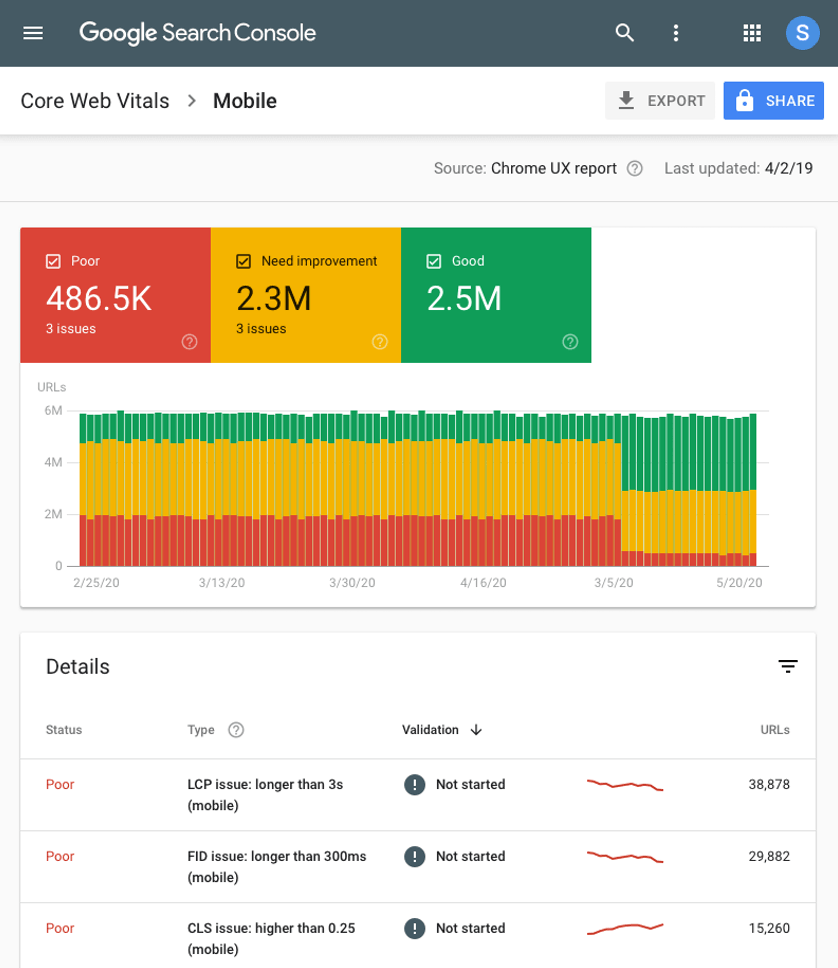
Search Console
The Google Search Console gives you access to field data. With its help, you can access the Core Web Vitals report, for example. This allows you to see how well your pages are doing in terms of performance and identify those that need extra attention.
Example of the Core Web Vitals report in Google Search Console
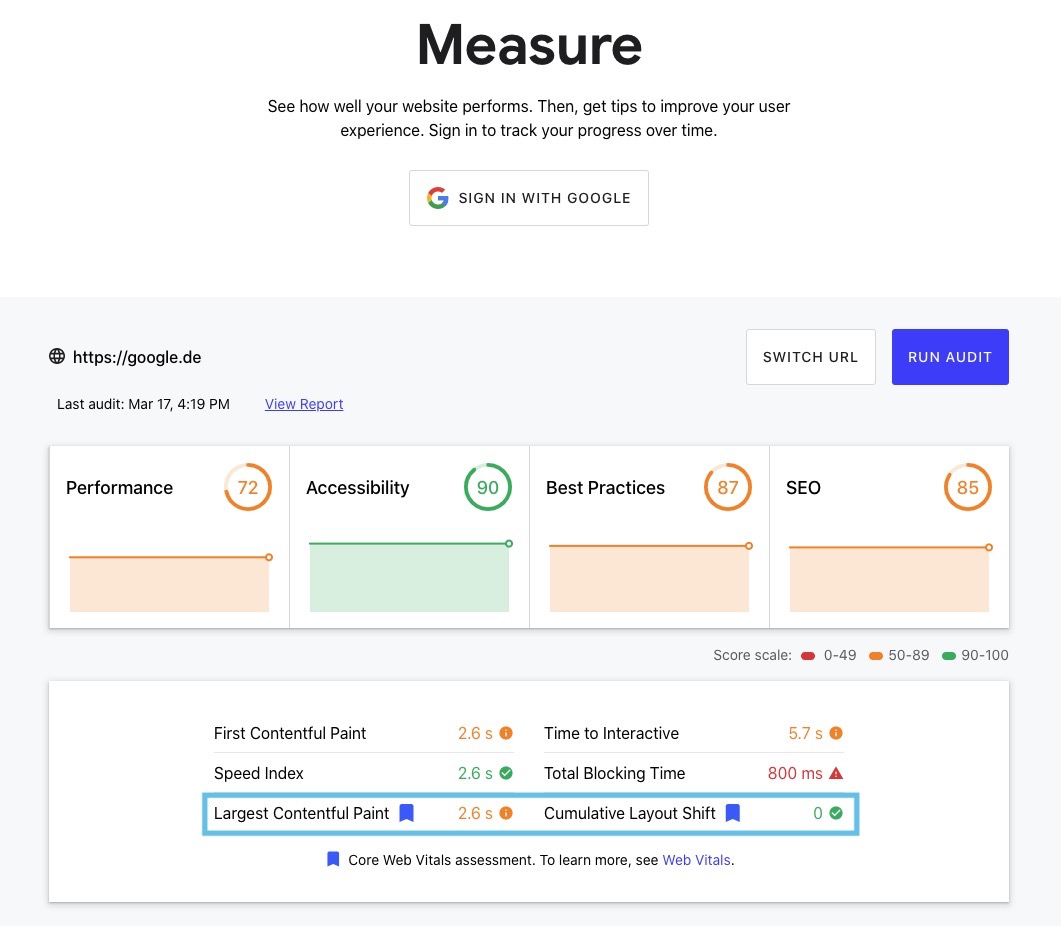
Chrome DevTools
Chrome DevTools is a whole set of web developer tools. So you can diagnose problems faster. You just want to do a quick check and see how your site is performing? You can do that very quickly with the DevTool Measure. Here you also get a direct insight into the Core Web Vitals, which are marked with a blue flag, just like in PageSpeed Insights.
An excerpt from the DevTool Measure with the Core Web Vitals (marked in blue).
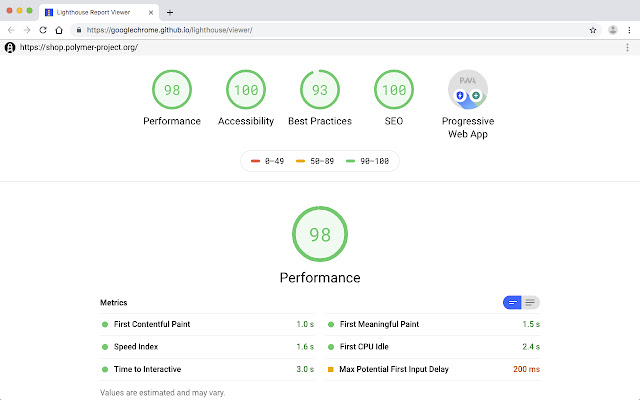
Lighthouse
Lighthouse helps you improve the quality of your websites. The tool accesses lab data and creates audits for performance, accessibility, progressive web apps, SEO and more. This way, you can identify issues in various areas and improve user experience. Core Web Vitals are also implemented here. This gives you important diagnostic information that you can use to draw conclusions about your site and appropriate optimizations. Lighthouse is also available as a Chrome extension.
Example of Lighthouse Chrome extensionThis is how the Lighthouse Chrome extension looks when it has measured the metrics.On the left image you can see the extension on the top right of the browser; on the right image you can see how the Lighthouse Chrome extension looks when it has measured the metrics.
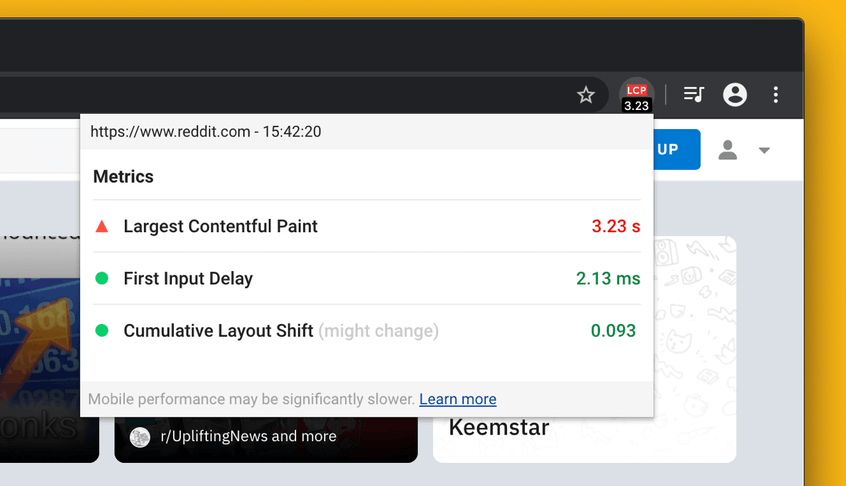
Web Vitals Extension
The Chrome extension “Web Vitals” can be downloaded from the Chrome Web Store here. It allows you to detect problems early and evaluates the three Core Web Vitals metrics in real time.
The Core Web Vitals extension shows you the values of the Core Web Vitals metrics directly in the upper right corner of your browser window.
Other tools that give you insights into Core Web Vitals metrics include
Of course, there are other tools besides Google tools that you can use to gain insight into Core Web Vitals metrics.
Sistrix
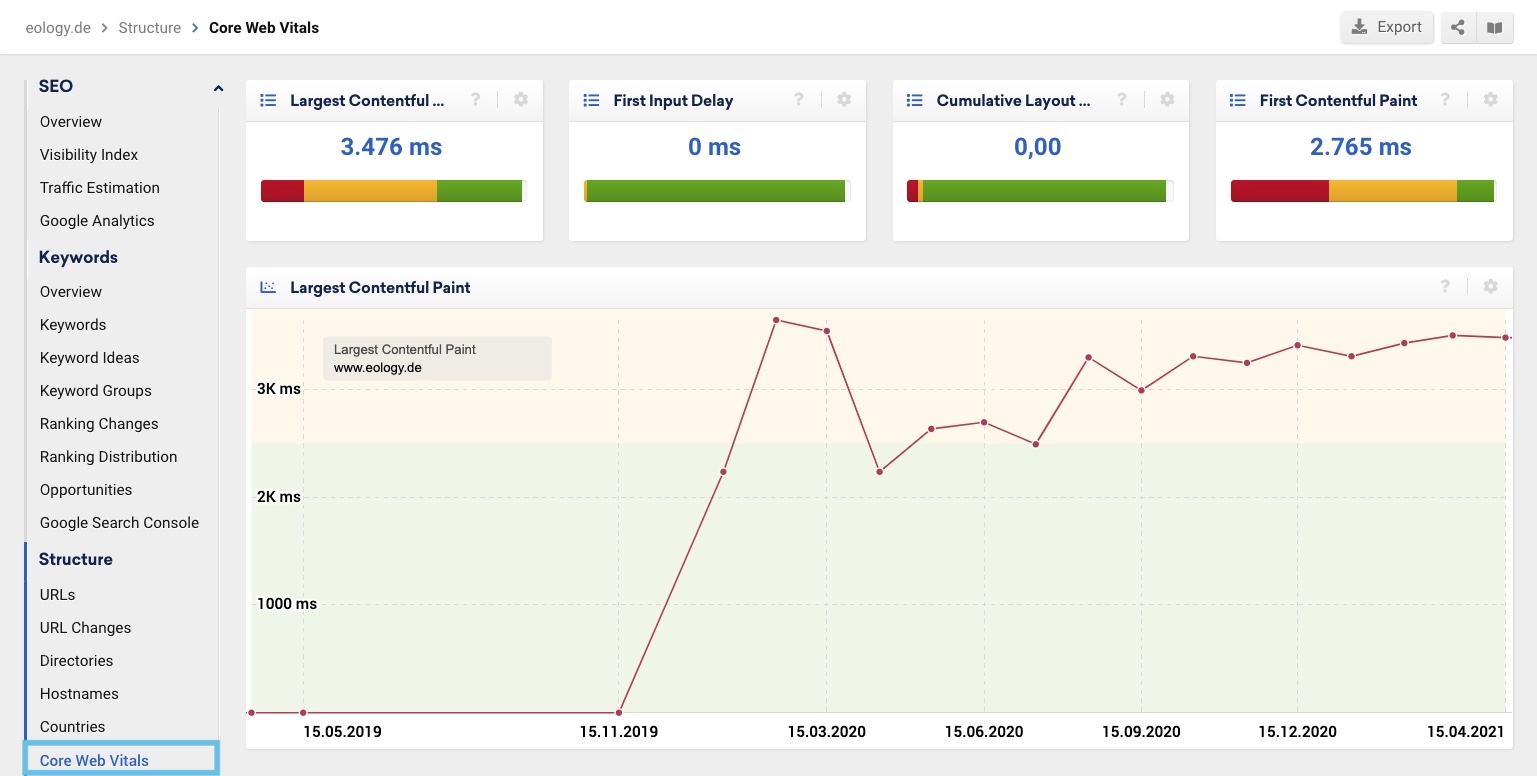
Sistrix has added a new feature to the tool as part of the Page Experience update. You can access the “Core Web Vitals” tab via the Structure area. This then shows you an overview of the various measured values. In addition, it shows you a graphical progression over time for all three Core Web Vitals metrics. The values are divided into three colors according to your performance. These are based on the predefined values from Google (you can find more details in the next section).
This is how the Core Web Vitals function looks in Sistrix, source: Sistrix
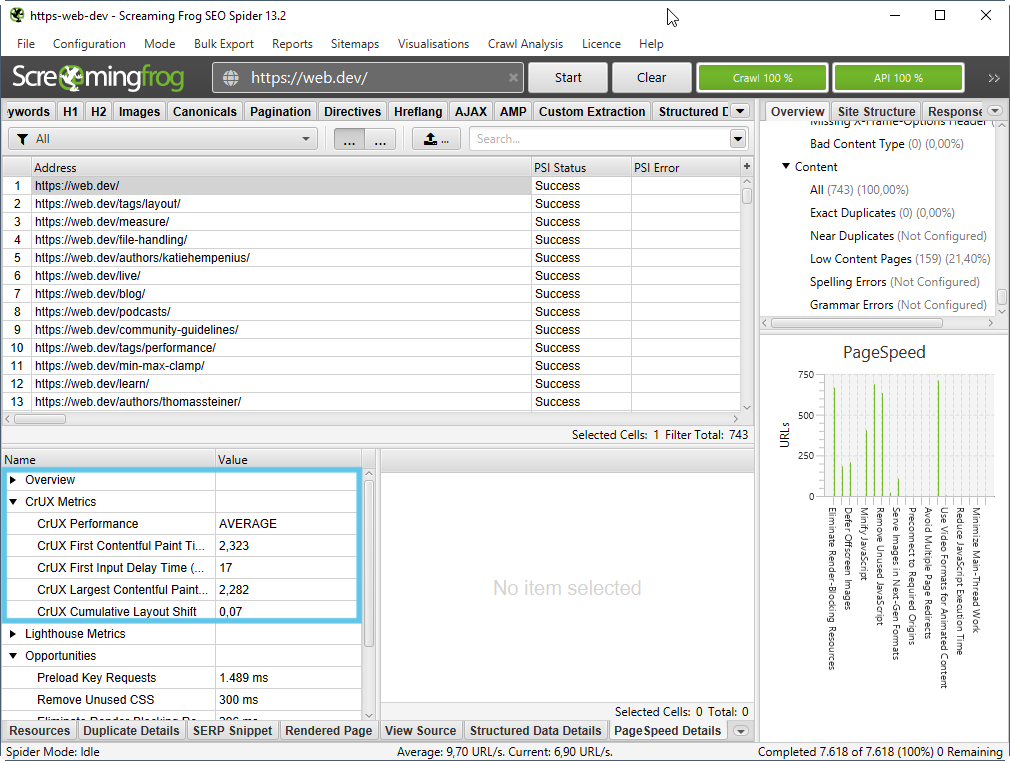
Here you can find the Core Web Vitals metrics in the Screaming Frog SEO Spider tool
Core Web Vitals 1×1 – You should know these components
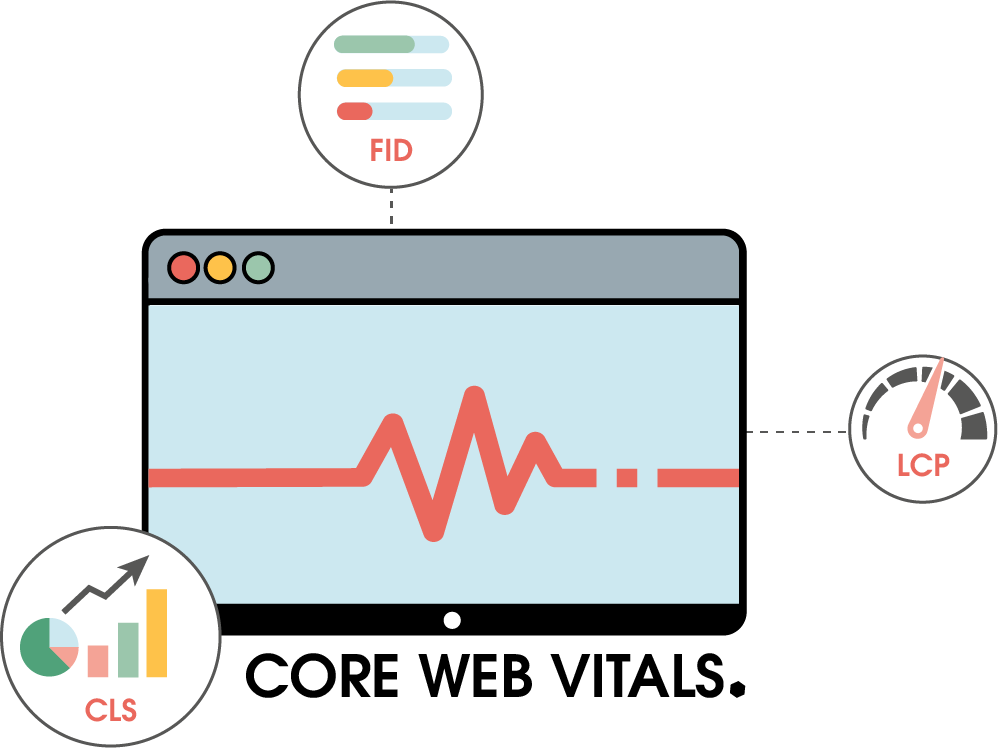
A closer look at the Core Web Vitals reveals that they are composed of three different components:
Largest Contentful Paint (LCP)
First Input Delay (FID)
Cumulative Layout Shift (CLS)
There is a reason why this metric is split into three parts: On the one hand, it has long been very difficult to measure when and how quickly a page is fully loaded or how it performs. This should now be simplified by splitting it into the above-mentioned areas. On the other hand, it is easier for webmasters to recognize which part of their website needs more attention and should be optimized.
LCP – Largest Contentful Paint (loading time)
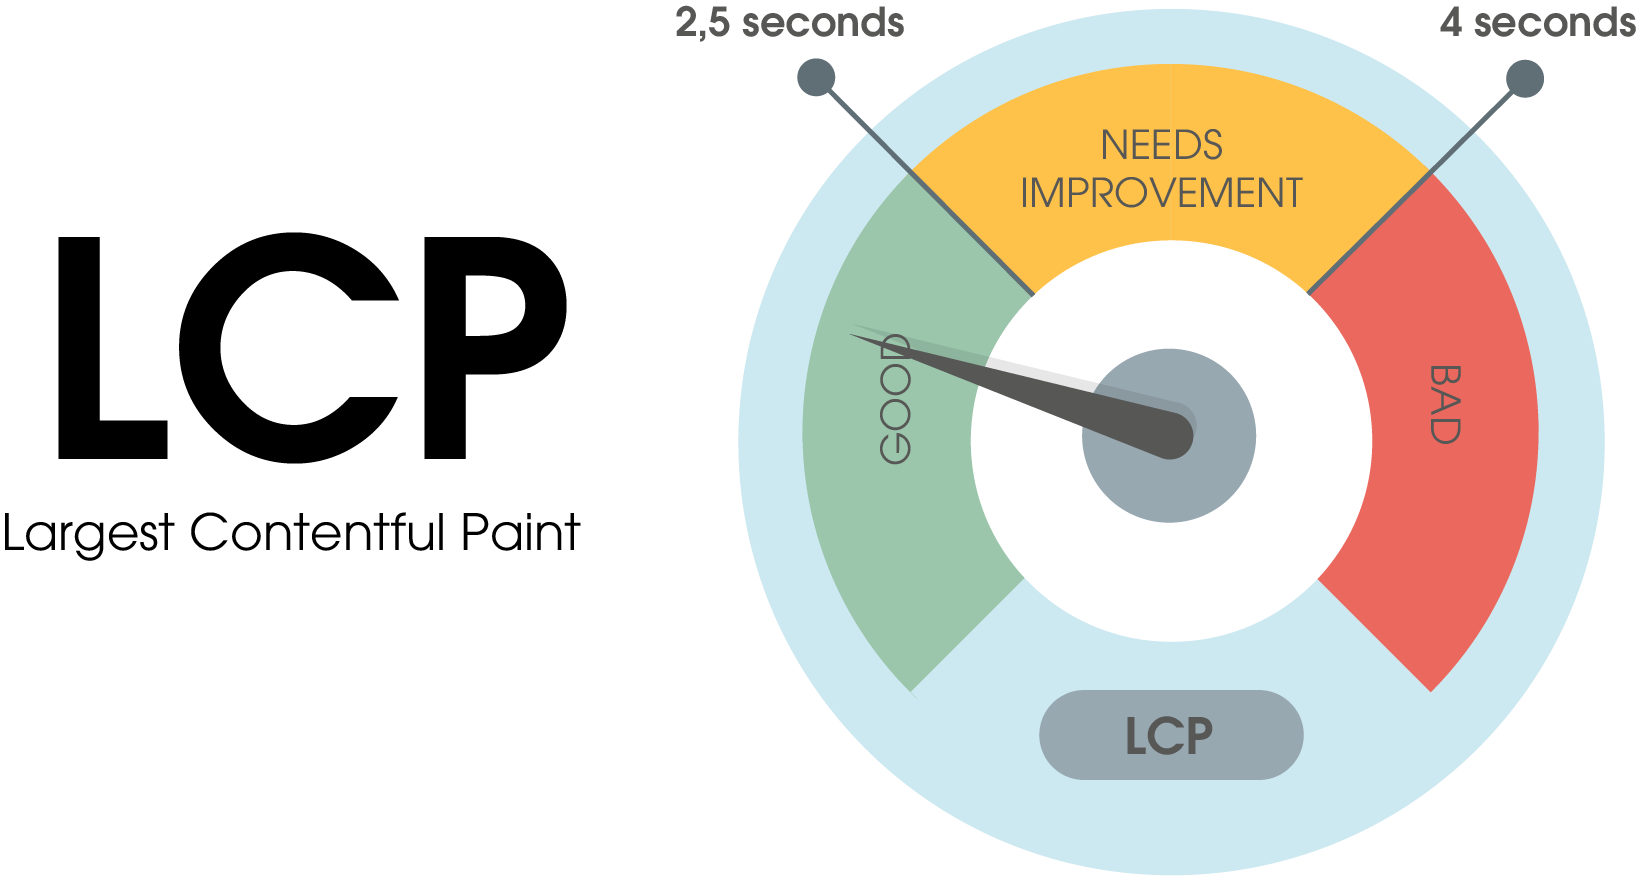
When is the main content of the website loaded? This question is addressed by the Largest Contentful Paint (LCP) metric. The value indicates how high the render time of the largest image or text block of the website is.
If you want to provide your website visitors with a good user experience, an LCP score of under 2.5 seconds is perfect. This means that users can see the main content of the page within this time. Google recommends keeping at least 75% of all measured LCP values in the green zone. If you achieve this goal on both mobile and desktop, your site has a good LCP score.
What is included in the analysis of the LCP?
Google considers the following to calculate the LCP:
block-level elements that contain text nodes or other inline text elements
All the above components are included in the size in which they are also displayed to the user. Margins, borders or similar configurations via CSS are disregarded.
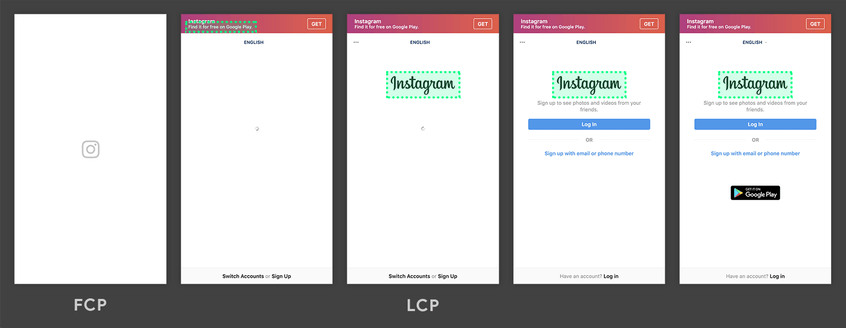
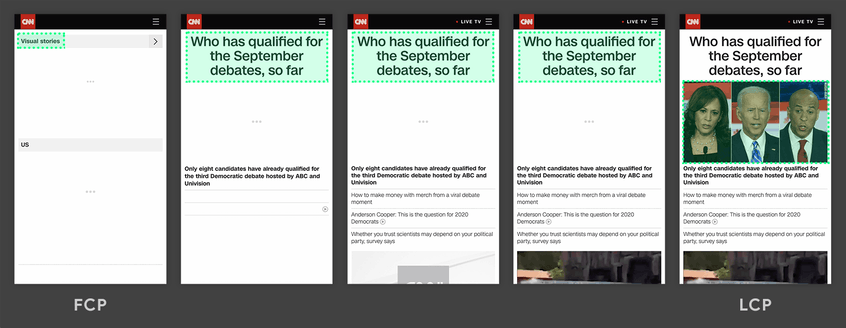
What is the difference between FCP and LCP?
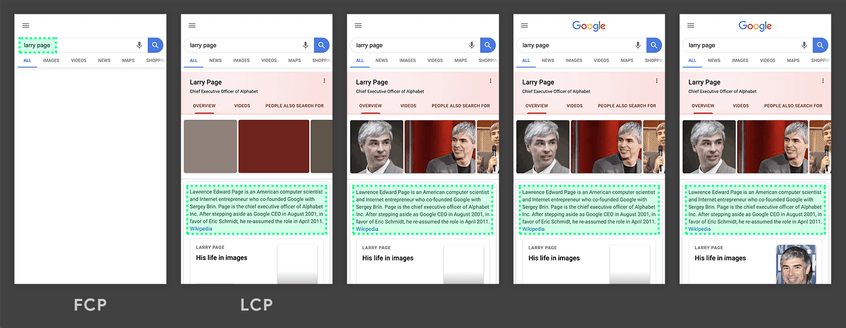
FCP, also First Contentful Paint, is the term for the first element the user sees when loading a website. Unlike LCP, however, this can be a loading animation, a placeholder, or something completely uninteresting to the user. The following examples illustrate the difference:
FCP vs. LCP – The differences in loading time, example website Google
FCP vs. LCP – The differences in loading time, example Instgram
FCP vs. LCP – The differences in loading time, example website
In all three examples, you see the largest content at the respective time framed in green. This changes in the course of the loading process and does not necessarily always have to be the image of a page (see example 1). Here you can see that all single images are smaller than the text block itself. Thus the images are subordinated to it.
The FCP is therefore already measured when the user can see even a single element on the page. The LCP, in turn, is only reached when the largest element of the page is loaded. The background is as follows: Google assumes that the largest element is also the one that provides the user with the greatest added value.
How can you determine the LCP?
These tools will help you to analyze the LCP:
Chrome DevTools
Lighthouse
WebPageTest
You can take a closer look at field data for your site using the following tools:
PageSpeed Insights
Search Console (Core Web Vitals-Report)
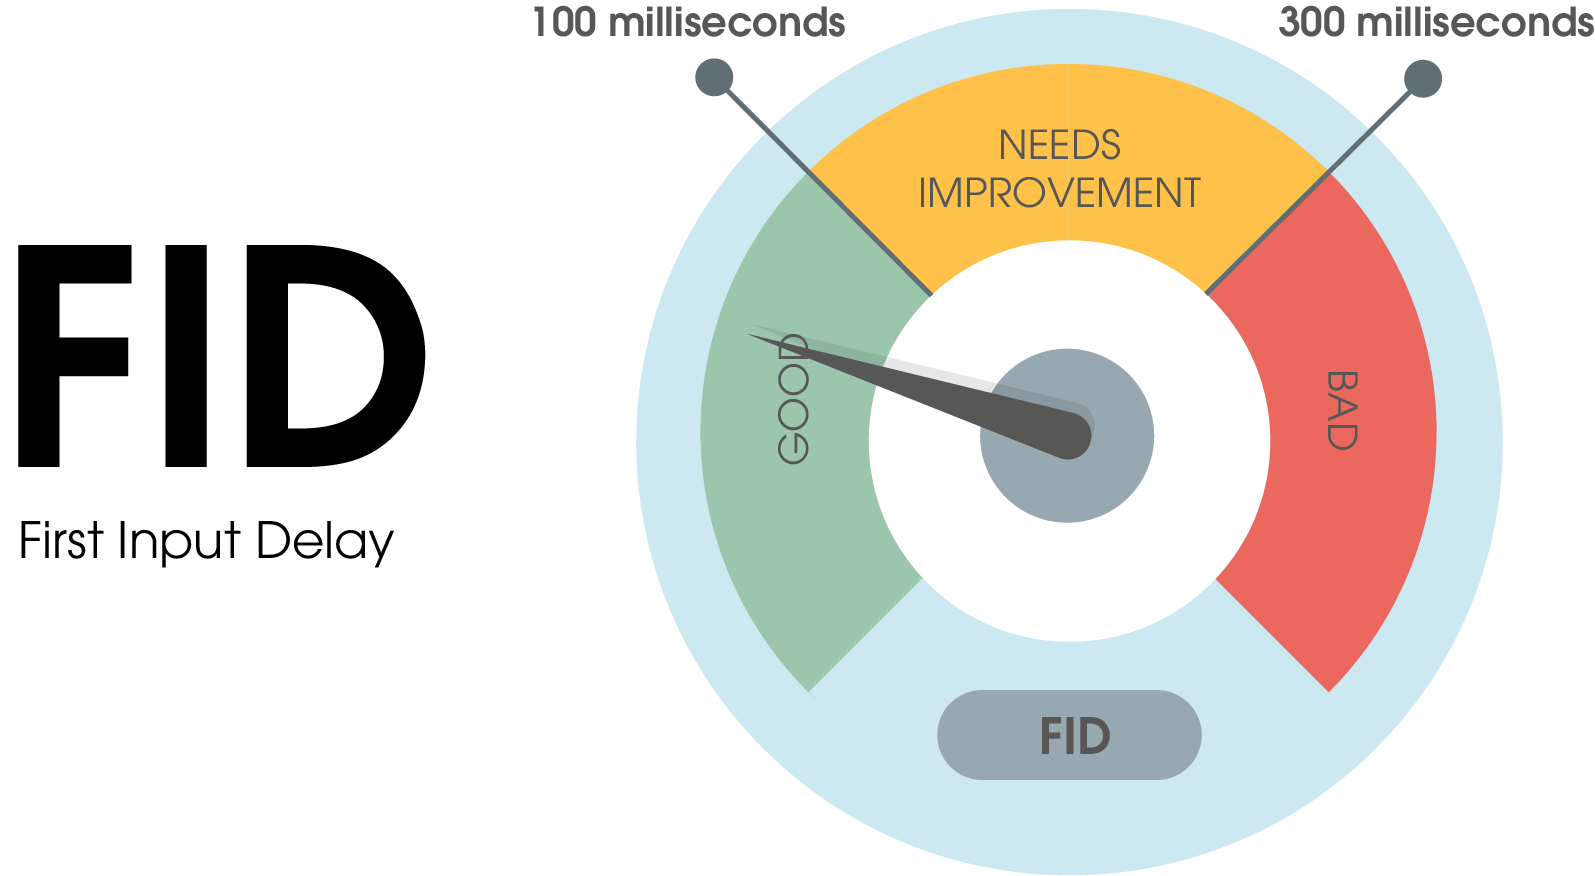
FID – First Input Delay (interactivity)
How long does it take for a user to interact with the website or for the site to respond to the user’s first input? This time span is measured with the help of FID, the “first input delay”. This gives you an idea about the interactivity and responsiveness of your website.
A good FID score is less than 100 milliseconds. This means that the website does not need more than the aforementioned 0.1 seconds to be ready and responsive for the first user input, both on mobile and desktop. Google sees room for improvement up to 0.3 seconds. However, anything that takes longer will result in a poor user experience. Thus, anything that takes over 100 milliseconds should be optimized.
Why is FID only about the first input?
The first impression is crucial – whether in reality or in virtual life. If there are delays here directly, this affects the user experience with the page. In addition, the first impression is a large part of the overall impression. As a result, many users draw irrefutable conclusions about the quality and reliability of the website.
Another important point is that the biggest interactivity problems often occur when the page is loading. That’s why it’s important to measure how well things are going at this point, and ideally where improvements need to be made. If you improve these first seconds, it will have a big impact on the overall interactivity of your page and put your website visitors in a positive mood.
What is considered the first input?
FID primarily measures input events. These include discrete actions, such as:
Scrolling and zooming are again continuous actions. Therefore, they are not included in the FID metric.
How can you measure your FID value?
Google has also already integrated this metric into some in-house tools. You can get your field data here:
PageSpeed Insights
Search Console (Core Web Vitals-Report)
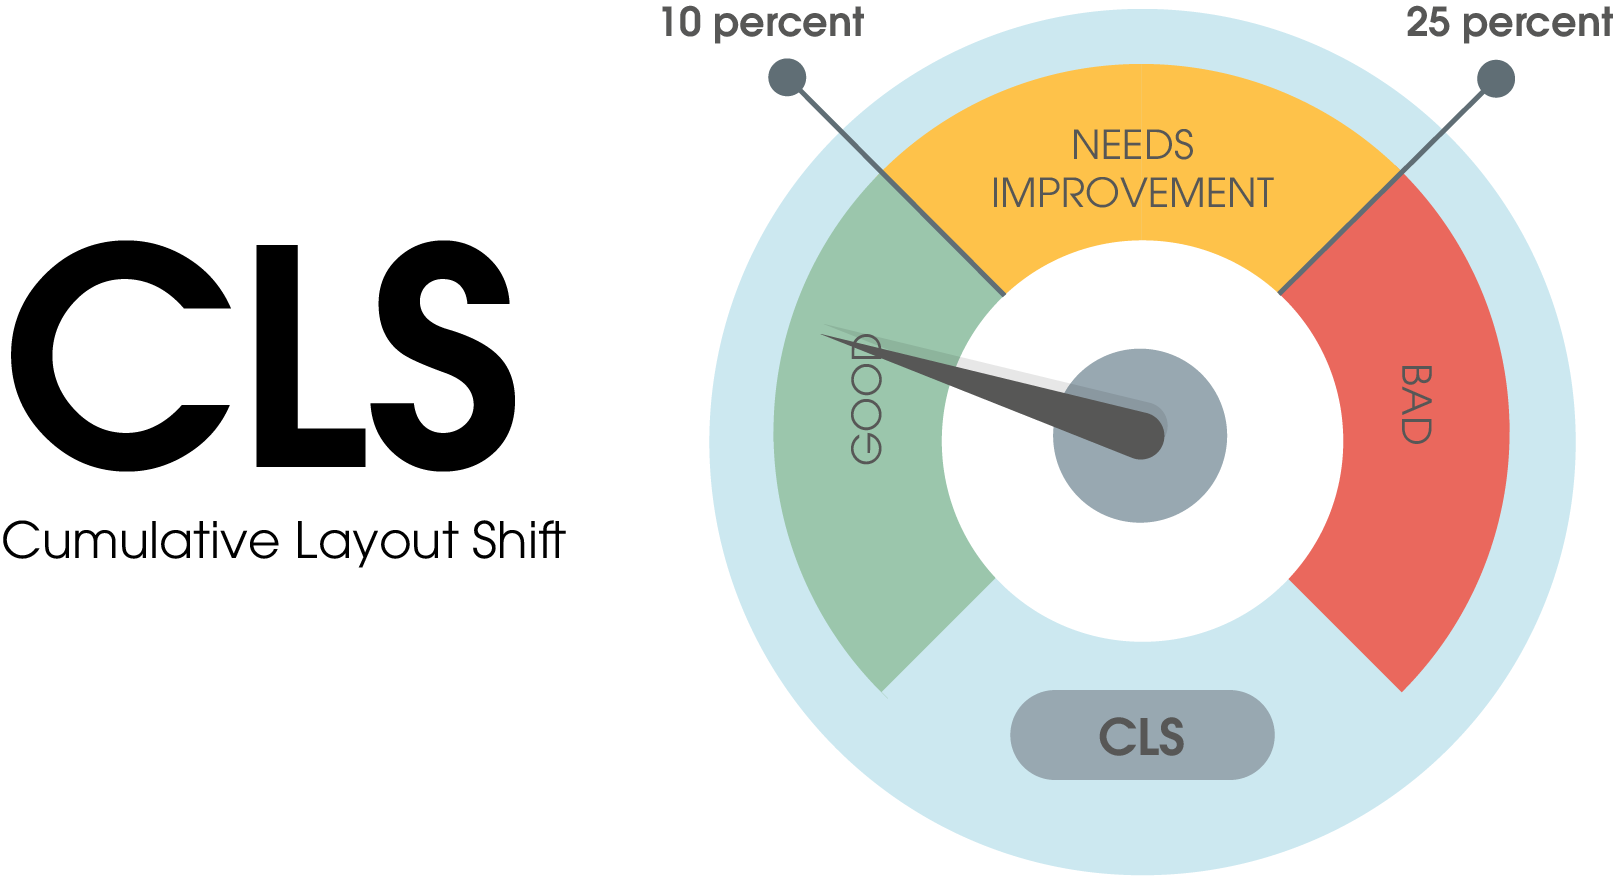
CLS – Cumulative Layout Shift (stability)
Who doesn’t know it: A website loads, you want to click a button and – poof – the complete page content shifts and you press something else in the worst case.
This kind of instability on the page negatively affects usability and user experience and leads to annoyance for your website visitors. To assess how much your page is affected by this type of unexpected shift, there is a metric called Cumulative Layout Shift (CLS). This is used to measure the visual stability of a page. This includes not only button shifts, but also shifts of images, videos, text blocks, etc.
The CLS score is calculated as follows: The affected portion of the website (affected area) is multiplied by the percentage of shift. The resulting percentage value is the CLS.
A good CLS score is achieved with a percentage shift of less than 10%. However, if the content shifts by more than 25% after the page has fully loaded, there is an urgent need for optimization.
NOTE:
Shifts that are triggered by the user himself, so-called expected shifts, are not problematic in principle. Therefore, they do not have a negative effect on your CLS.
Update: New limits for CLS
Google reacted to feedback from webmasters by adjusting the CLS metric – the company now announced this in a statement on the Web.dev blog. The time of session windows, which are used to measure the shifts, is now limited to five seconds. The time between windows is one second. A session starts whenever a layout shift occurs. It ends when no shift has occurred for a certain time. As a result, the individual layout shifts are grouped together. This is to enable an intuitive merging.
Here you can see the individual sessions including the one-second pause (session gap), source: Google
Improve the CLS value – but how?
If you notice unexpected layout shifts, you should take action. Google recommends three specific points that will help improve your CLS score.
Using size attributes or saving space If you use size attributes for images and video elements, you make sure that the browser knows how much memory it needs when loading the image/video. Accordingly, much space is then free for it. Alternatively, you can also “reserve” the memory space. This can be done with CSS aspect ratio fields, for example.
Do not overlay content Avoid overlays, i.e. inserting content above existing content. This is only useful if you are responding to user interaction.
Movement and animations
If transitions are animated, it feels more fluid and less abrupt to the user. Whenever content moves to its final location naturally, it increases your chances that website visitors won’t find it annoying and won’t have a bad user experience despite a slight “shift”.
How can the CLS be measured?
To find out the CLS value, both field tools and laboratory tools can be used. These are available to you:
Field Tools
PageSpeed Insights
Search Console (Core Web Vitals report)
Lab Tools
Chrome DevTools
Lighthouse
WebPageTest
Do Core Web Vitals have an impact on SEO?
The answer to this question is quite clear: Yes! But with a simple yes, the answer is not yet complete – there is more to it. Like all ranking factors, Page Experience has an influence on the positioning in the search results. But it’s not going to be the new non-plus-ultra ranking factor – even though that’s all the buzz in the Google universe right now. Core Web Vitals in combination with existing User Experience signals are important, no question. But they only look at technical aspects of a website. Content and keywords are nevertheless significantly involved in the position on which your page ranks on the SERP. This means that in practice your site can rank well even with poor page experience signals. However, if it is in competition with a similarly relevant website with better page experience values, the latter will receive the higher ranking. This is why Core Web Vitals are essential in search engine optimization. The logic behind this is quite simple: the more ranking signals you can serve well, the better your ranking.
Google’s Gary Illyes posted the following statement about it on Reddit:
“Like any other search engine, Google works hard to provide the highest quality and most relevant results for users’ search queries. CWV has nothing to do with either of those, not even remotely, so it’s highly unlikely that CWV would ever become ‘the primary driver of organic traffic.’ But that doesn’t mean CWV can be ignored.”
Garry Illyes, Webmaster Trends Analyst
Why do you need a Core Web Vitals SEO optimization?
Slow pages, content that shifts or doesn’t respond – these are all issues that drive users crazy, especially on mobile devices. However, since access via mobile has been increasing for years, it is becoming more and more important to optimize websites for this. By 2020, 80% of all internet users were already browsing the web on a mobile device. Core Web Vitals are designed to do just that: They measure the user experience of pages and therefore have a major impact on mobile rankings, at least initially. Before the newly introduced Core Web Vitals, the following signals were relevant for this:
Mobile usability
Secure surfing
HTTPs
The rules to avoidannoying intersitital
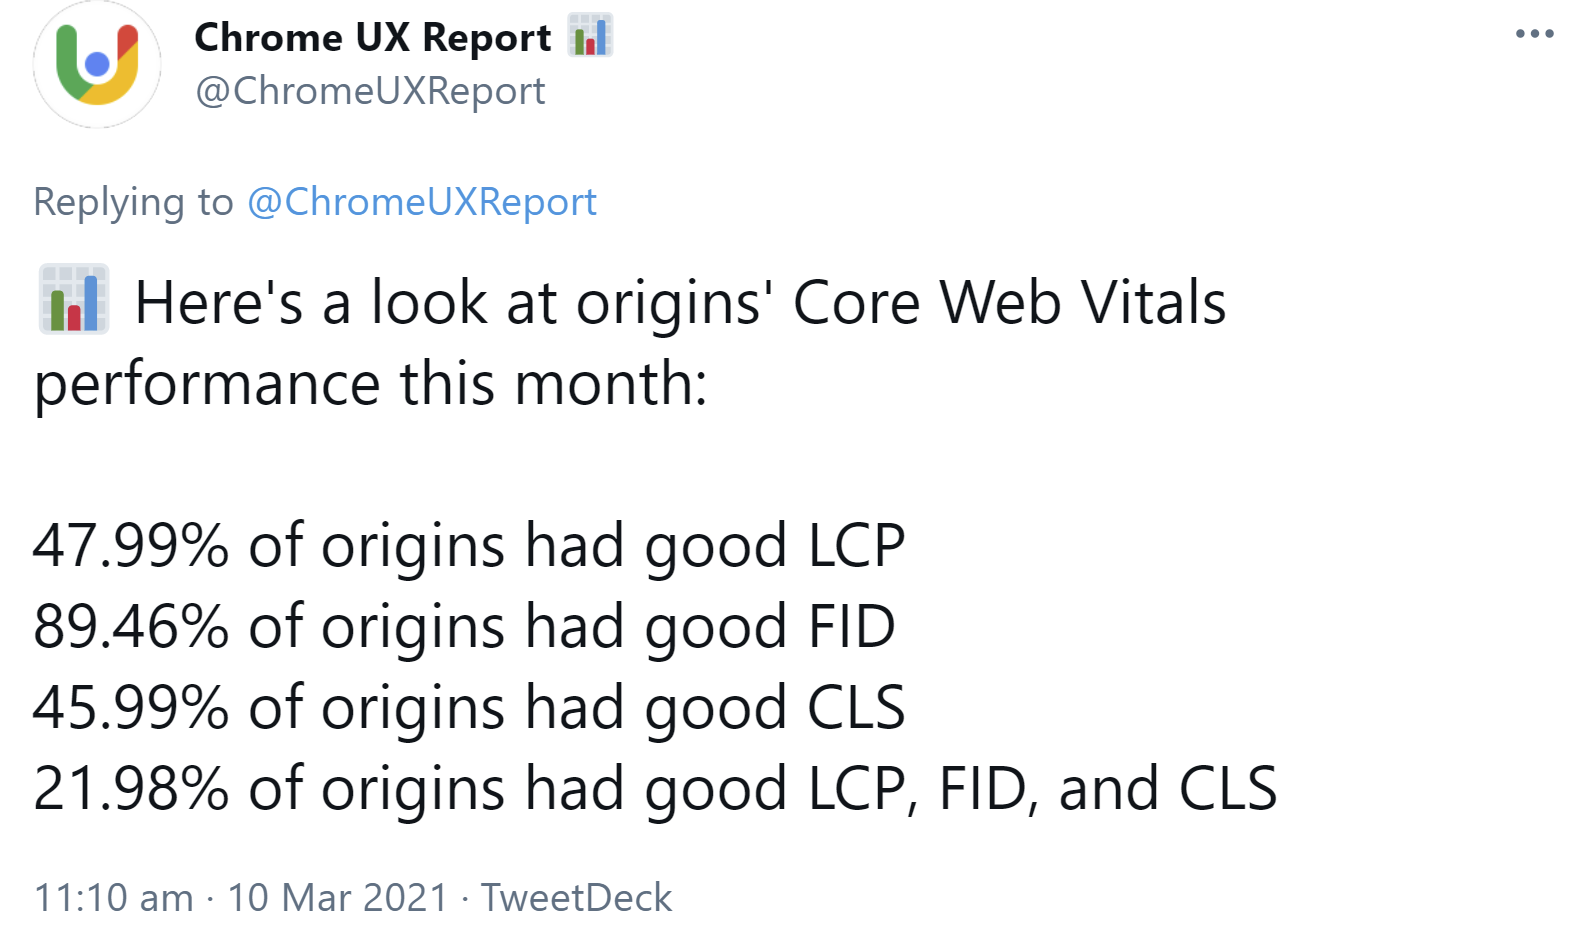
With the Page Experience update, these are now combined with the Core Web Vitals to form a new ranking factor. So, in order to stand out from your competitors, in addition to informative and high-quality content, you should also make sure that the technical aspects are right. In addition, right now is still a good time to carry out optimizations. Current data from the Chrome UX Report shows that only about 22% of all domains reach the recommended Core Web Vitals values.
Only about 22% of all domains achieve good scores on all three Core Web Vitals metrics
The Chrome User Experience Report includes real user data in its analysis, which Google uses to evaluate the page experience. Google refers to different domains as origins.
A new study by Searchmetrics also shows: More than 97% of all websites studied do not achieve satisfactory Core Web Vitals results in German desktop search. In mobile search, it is 85%. All these sites thus risk ranking losses from the introduction of the Core Web Vitals score in June. Two million websites in the top 20 Google search results in Germany, the USA and the UK were analyzed.
Conclusion – Page Experience Update and Core Web Vitals
With the Page Experience update and the introduction of the Core Web Vitals, Google takes another step towards user-centricity. This update makes it clear that the search engine giant wants to cater more to the needs of its users. Thus, it subtly makes webmasters improve their own pages to that effect. This affects pages that already provide value-added content and rank well, as well as pages that have had difficulties ranking so far. Therefore, if you have optimized your site for the three measures of Core Web Vitals (LCP, FID and CLS), this will increase your chance of good rankings in the search results.
Do you have any questions that you would like to have answered? Then send them to us at marketing@eology.de!
Are you looking for a tool to optimise your backlink and SEO strategy? Get to know LinkResearchTools (LRT), which offers you in-depth insights into your link profile and helps you identify harmful links and avoid potential Google penalties. ... Continue readingLinkResearchTools for backlink analysis and SEO optimisation
You should definitely consider content seeding as an online marketing strategy for you and your brand or company, because it makes a valuable contribution to the off-page optimization of your website. It involves strategically placing high-quality content where it will generate reach. Click here to read more about it. ... Continue readingContent seeding