Roughly speaking, Google Analytics is a free tool from the Google Marketing Platform, which hosts several tools since the rebranding of Google Ads. It helps you to perform web analytics. In detail, this means that it allows you to analyze your online and marketing activities in-depth. Analytics is free in the basic version, but if you want to upgrade the tool to Analytics 360, it costs, like all 360 products of the Marketing Platform. However, you can also use the tool very well for analyzes in the free version. Here it helps you especially to examine and track campaign successes and user behavior on your site. This makes it easier for you to find out where the strengths and weaknesses of your website lie. However, the continuous analysis can only be done by integrating the tracking code into the source code of your site. How exactly you have to proceed, you will learn in the First Steps guide from Google.
The web analytics in general
The days when a website was just a signboard are long gone. The fact is: your website is a real online marketing multi-talent. That’s why you should urgently exploit its full potential.
Best of all, you can target your content to a very specific audience – your target group. This is exactly where web analytics, also known as traffic analysis, comes in. This is preceded by so-called web tracking, i.e. the collection and recording of data on the web, which serves as the basis for subsequent analysis and evaluation. Web analytics should help you to control the success of your website in the long term and thus improve its efficiency.
Many online measures struggle with high wastage. These bring very little effort and ensure that you waste your resources unnecessarily. Thanks to current technologies, such as Google Analytics, you can take a closer lookat these losses. This in turn helps you to plan and design all actions more precisely. By collecting data on the behavior of your website visitors, you can make an accurate analysis that will help you predict future behavior better. This in turn can clearly influence your decision-making process and help you monitor the success and optimization of your website.
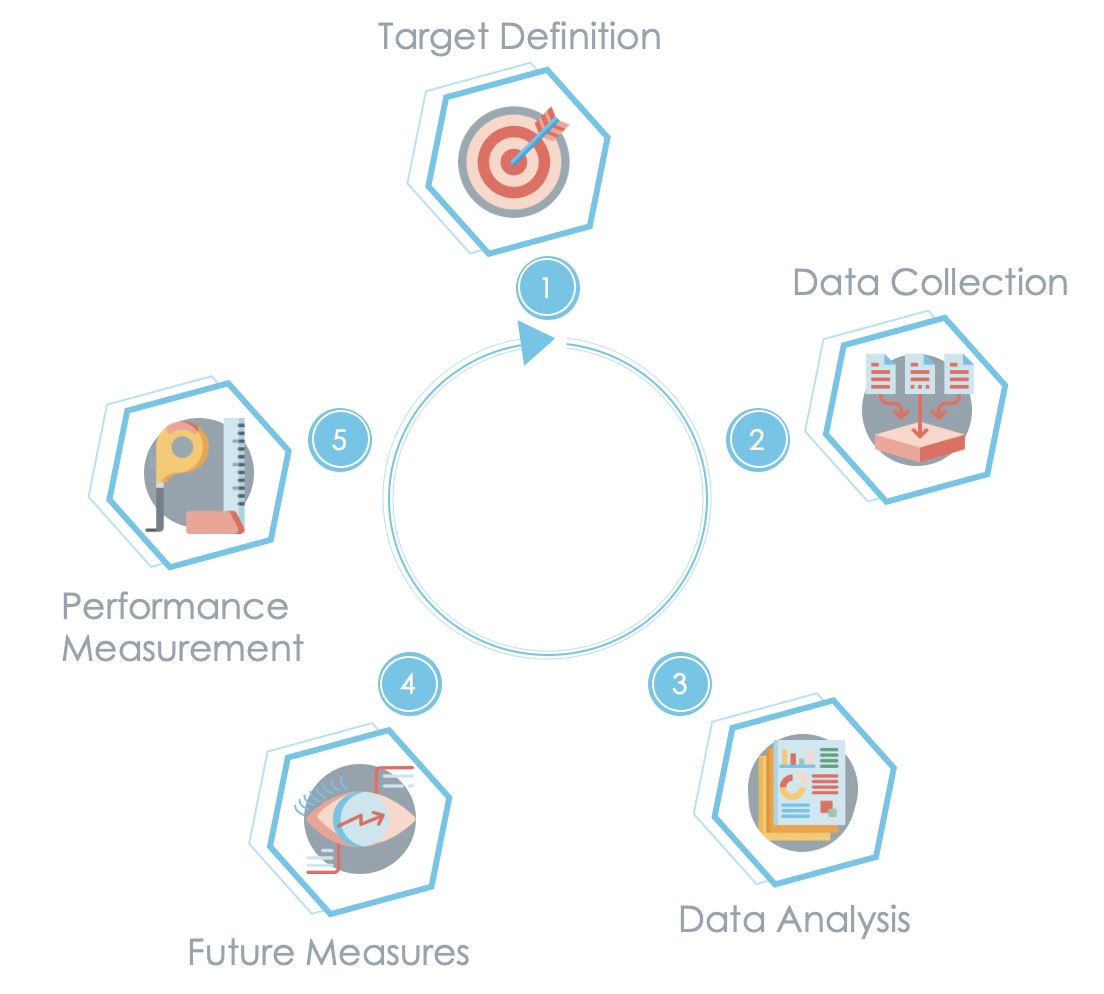
In summary, we can say that a certain cycle is created in web analysis. The definition of the goal is the starting point, whereupon data collection begins, which is subsequently interpreted. In the fourth step, measures are derived that determine future actions and procedures. This is followed by the measurement of success. After that, the process starts all over again in order to constantly improve and exploit all potentials.
Web analytics cycle
What insights do you get thanks to Google Analytics?
Google Analytics gives you various insights. For example the following:
As a further function, you can define individual goals and measure your conversion rate, i.e. the ratio of visits or clicks to conversions. How exactly these goals look, however, is up to you. It can be newsletter signups, but also measuring the success of your marketing measures. In addition, you can now even link your social media channels with Google Analytics. This gives you a better overall picture of your performance.
Google is continuously improving its Analytics tool, which is why new features are added all the time. It is therefore important that you always stay up to date so that you don’t miss anything. You can find information about this on Google’s Analytics blog, for example.
How does Google Analytics work?
Google Analytics does not collect personal data – many people often get this wrong. On the contrary, it is explicitly stated in the terms & conditions that these may not be linked to Google Analytics. In times of General Data Protection Regulation (GDPR) this is in fact important to emphasize: Google Analytics never analyzes a single user but instead aggregated groups, values and trends. In addition, tracking is often blocked by different software programs, which is why the analyses give clear directions, but do not have to be 100% accurate.
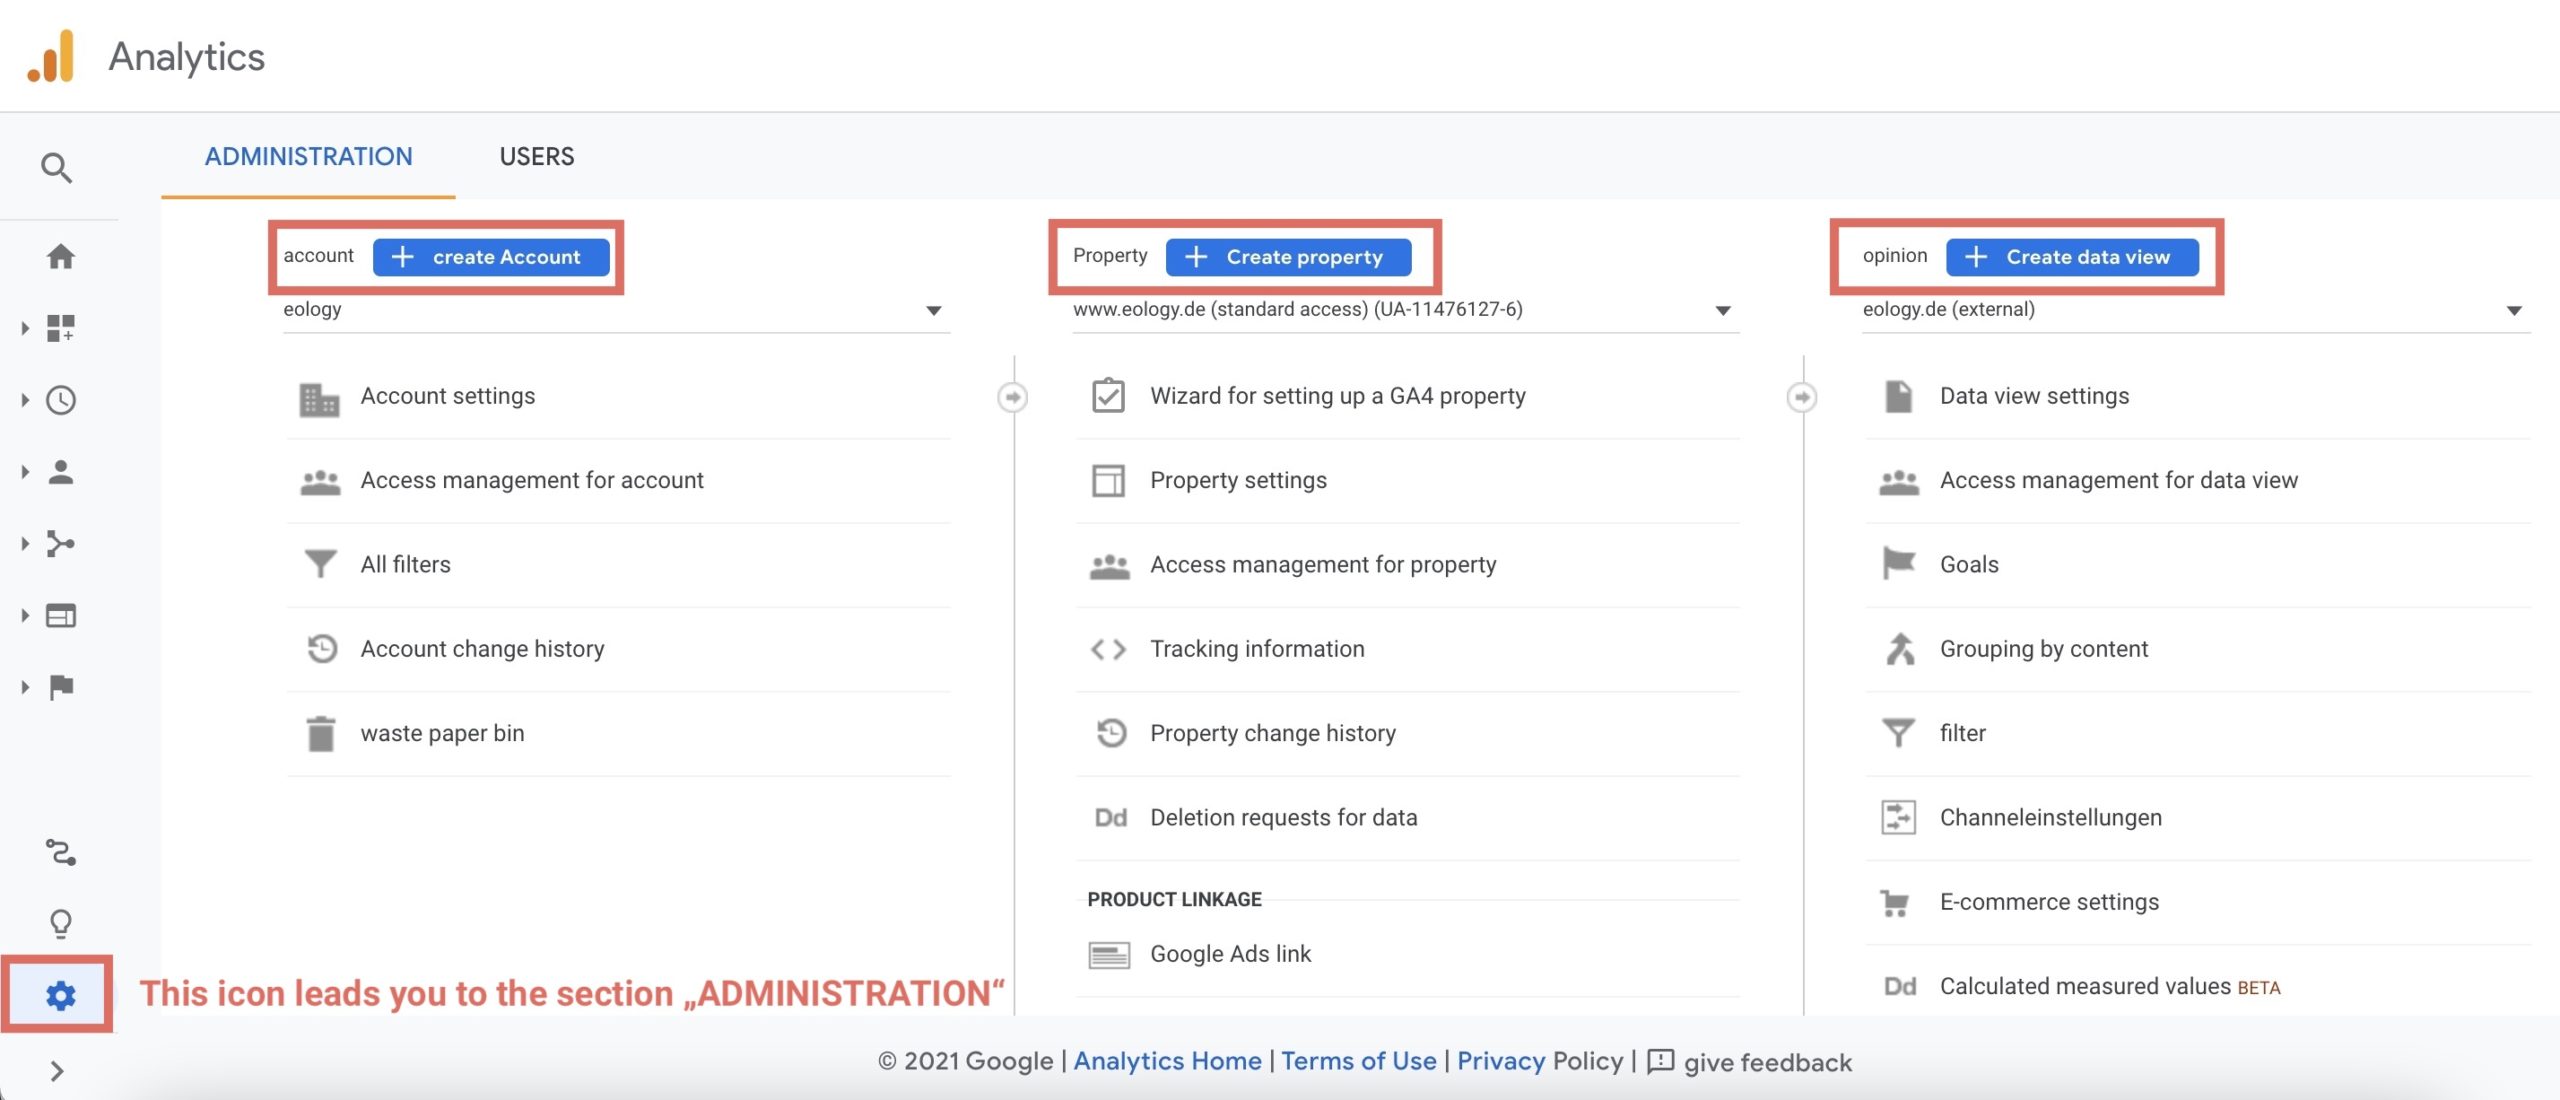
The tool uses cookies for data collection, which are activated by the Google Analytics tracking code embedded on your website. First-party cookies are then stored with your visitors and regularly send information that is exclusively transmitted to Google Analytics. Since this is first of all raw data that does not really help you, it is processed in the second step. How this is done depends on your configurations. In the “Administration” section, you can therefore make various settings in three different levels within your account:
Each account can contain up to 100 Analytics accounts, 50 properties, 25 data views and 20 targets. You can define targets yourself under Data View.
Account setup Google Analytics
How do you create a Google Analytics account?
As with Google Ads or similar Google tools, creating an account with Google Analytics is made really easy. If you already have a Gmail account or use another Google product with a different email address, you can log in with that. The login data you use here is valid for all Google products.
If you don’t have an account yet, you need to create one with a valid email address. You can do that easily here.
Once you have created the account and are logged in, you can log in via the Google Analytics website.
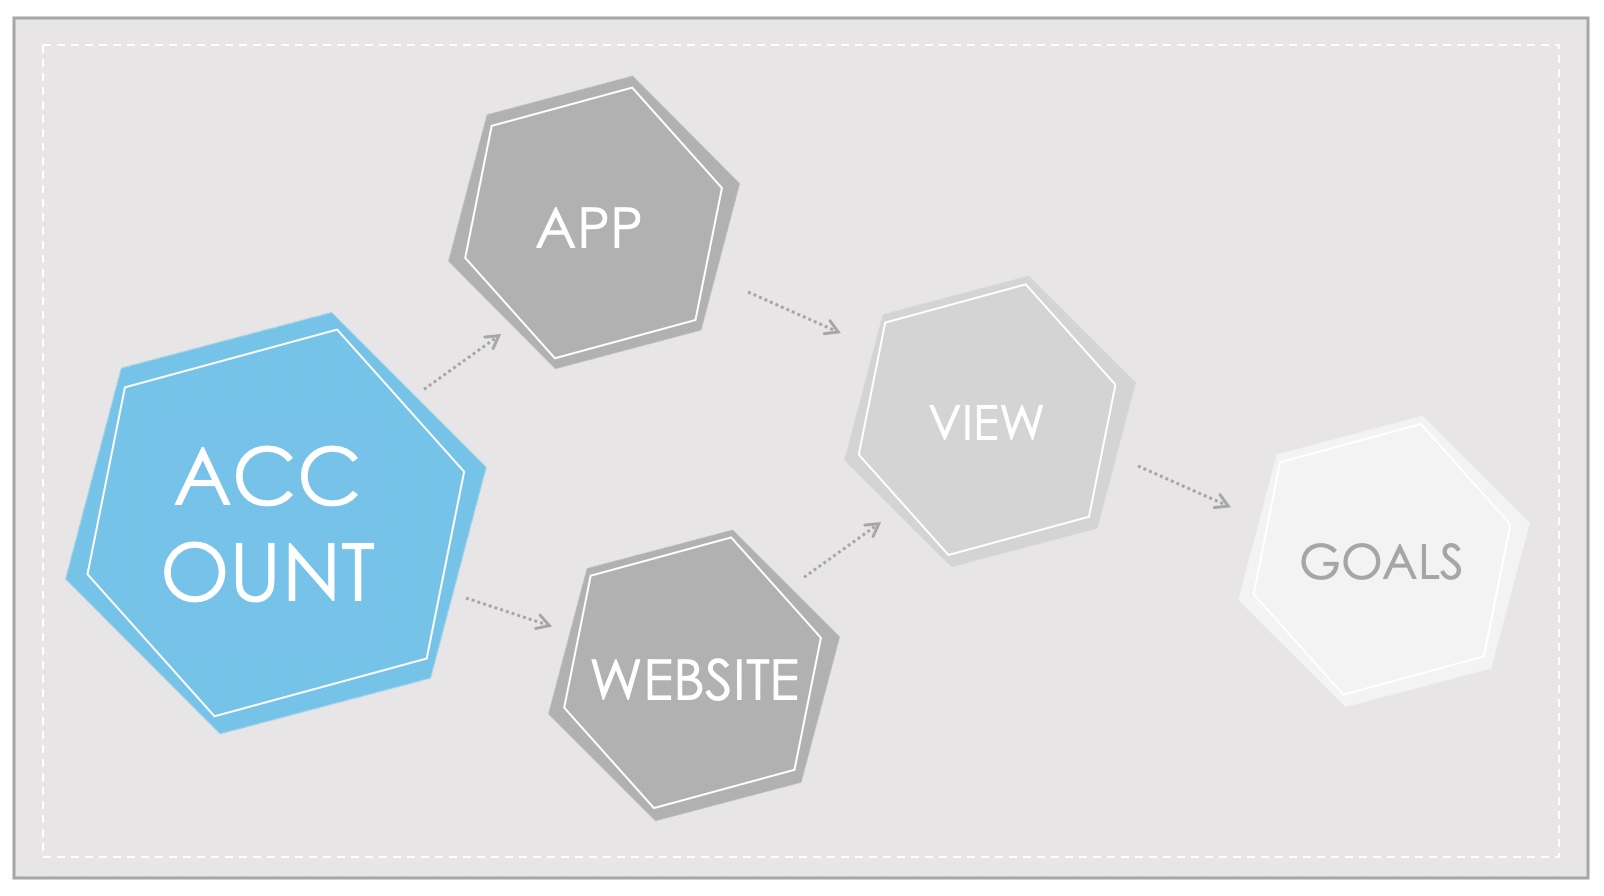
Now it’s time to set up the account. The following levels of organization are basic:
The account – the top level. Here you can enter, for example, the company name or something similarly suitable. It is important that all users can clearly see what is meant by this.
The property – here you select whether it is an app or a website. It makes sense to name it after the corresponding name. You can also enter the URL of the website, the branch of industry and the time zone here.
You set up report data views within the property.
You will also be asked for different data shares in this step. It is advisable (and also recommended by Google) to check all of them. The reason for this is that you can later link other tools such as Google Ads, AdSense, etc. with your Analytics account. If you have problems with the tool, the technical support will help you. If you don’t want to check the box for any reason, that’s no issue either. If you need assistance from support, you can also release your account to them at the appropriate time.
Once you have set everything up, you can retrieve the tracking ID – by the way, this is also the name of the tab you have to click for this. After you have confirmed the terms of use, you will receive your individual UA number and a Google Analytics tracking code. You insert this in the source code of all pages of your website that you want to analyze. Copy the code and paste it immediately after the tag. In order to collect all information in a privacy compliant way, you have to add the code extension “anonymizeIP” and set it to “True”. Alternatively, you can insert the UA number using the previously installed Google Tag Manager.
For data protection, it is also important that you conclude an Analytics contract with Google and place the adapted privacy policy on your website in an easily accessible manner. You can easily conclude the contract online. These are the steps you need to take:
Call Google Analytics.
Access the account settings via the navigation Administration > Select account.
Find the “Data management addendum” section and click on “Show addendum“
Accept, save and deposit contact persons.
Via the user settings, which you can recognize by the cogwheel symbol, you can make changes to your data even after creating the account.
How do you manage your Google Analytics account?
Your account is divided into three main sections:
Homepage
Adjustments
Reports
On the home page, you can see your Analytics accounts with their properties, apps, and data views. You get a complete overview of all analytics here.
In the Customizations tab, as the name suggests, you can make custom configurations and set up different dashboards.
Under Reports you can call up various evaluations in report form. Here you not only get an insight into the classic standard reports, but you can also make individual and personalized configurations.
What is the goal of Google Analytics?
The main goal of using Google Analytics is to collect solid data that you can then use as a basis for future actions. With these insights, you can plan, gain a deeper understanding and constantly optimize your website.
The target project was developed specifically for this purpose. The whole thing works as follows: You define your personal goals, then you can use Google Analytics to determine how well they are being achieved. This is important because you cannot measure success without specified goals. It therefore makes sense that you think clearly about the topic of company goals and define them unambiguously. The company goals are the basis for defining the website goals. These can then be subdivided into micro and macro goals. By evaluating your goals, you can then develop key figures that make it easier for you to recognize successes and compare them in the future.
Keep in mind: Google Analytics goals do not always have to be identical to website goals, as the focus here is on purely technical aspects.
Advantages and disadvantages of Google Analytics
Advantages
Disadvantages
Option to export all analyses
Data must be exported for secure, permanent storage
Link with Google Ads for better analysis of paid advertising
Uses of the collected data unknown
AdSense integration
Storage of data on US servers
Social media integration
Complex handling of the tool for laymen
Measurement of loading times
Complex configuration for laymen
E-Commerce-Tracking
Google as a data leech
Definition of individual goals
Paid variant could be expensive for smaller companies
Measurement of individual goals
InPage analyses
Better understanding of the overall user picture
Simplified analysis of special events
Working in a team possible
Free of charge in the basic version
Custom reports can be created
Why Google Analytics 4 (GA4)?
Google Analytics 4 (GA4) is the latest version of Google’s analytics tool. Unlike the previous version, Universal Analytics, GA4 is based on a completely new technology and offers advanced features for analyzing data.
At the heart of GA4 is the event-based model. Instead of focusing solely on page views, GA4 captures various events that occur on a website or in an app. For example, these events can be page views, clicks, interactions, conversion events, or custom actions. This allows more detailed information about user behavior and interactions to be captured.
GA4 also uses a more flexible data model. It allows data to be collected and analyzed across multiple platforms, including websites, mobile apps, and even offline sources. This allows companies to get a more comprehensive picture of the customer journey and track user behavior across different channels.
Another important feature of GA4 is the integration of machine learning and artificial intelligence. The tool provides automated insights and predictive models to identify patterns and trends in the data. This makes it easier to identify target audiences, optimize marketing campaigns and improve user experience.
In addition, GA4 offers enhanced privacy and data retention capabilities. It is better designed to comply with data protection regulations such as the GDPR and offers more control over data processing and retention.
Overall, Google Analytics 4 provides powerful data analysis tools and features to help businesses gain insights into user behavior, optimize marketing strategies, and improve the customer experience.
ATTENTION: Change from Universal Analytics to GA4 🚩
As of 01.07.2023, data will no longer be collected for Properties in Universal Analytics. It is therefore mandatory to switch to GA4 if Google is to continue to be used as an analytics tool. As of 07/01/2023, users will only have access to the previously collected data for 6 months. To avoid data loss, we recommend exporting all previously collected data by then. For users using Universal Analytics 360, the processing period will end exactly one year later, on 01.07.2024. We recommend everyone to switch over as early as possible to avoid data loss.
If you have any questions, we will be happy to help you and find an individual solution for your company. ⏳🚀
Search engine optimization, i.e. the improvement of the website in order to achieve better rankings within Google and the like, has become fundamental when it comes to placing a page on the internet. But in order to even know which optimizations need to be carried out, an extensive analysis of your website is necessary. You can do this with the so-called SEO or website audit. We show you here how to perform this. ... Continue reading
Are you looking for a tool to optimise your backlink and SEO strategy? Get to know LinkResearchTools (LRT), which offers you in-depth insights into your link profile and helps you identify harmful links and avoid potential Google penalties. ... Continue reading
Google Alerts is a useful tool that helps you keep up to date with all the topics that interest you. Learn how to use this tool, how to use it correctly and how to get the most out of it here! ... Continue reading