
Online Marketing
In online marketing, you have a wide range of options at your disposal. How they work and how you use them, you will learn here! ... Continue readingOnline Marketing

Portfolio analysis is a research method that can be used to evaluate the entire product range of your company. With this analysis you can get an overview of which products of your company have potential. The portfolio analysis is a tool for you to make important strategic decisions for your company. In principle, the analysis refers to the products and services of your company. However, you can also use it to evaluate different projects.
A portfolio analysis should give you an overview of the current situation of your products and services. It serves you as a controlling instrument for your strategic decisions and clarifies changes in the current market. You can design your analysis individually and adapt it to your application areas. This is a great advantage of this analysis. You can easily present complex issues, derive your actions and prioritize your strategy.
The BCG analysis was developed by the Boston Consulting Group and is one of the best known portfolio analyses. It is also known as BCG Matrix. The BCG Portfolio Analysis includes a 4-field matrix, which ranks your products depending on market growth and market share.
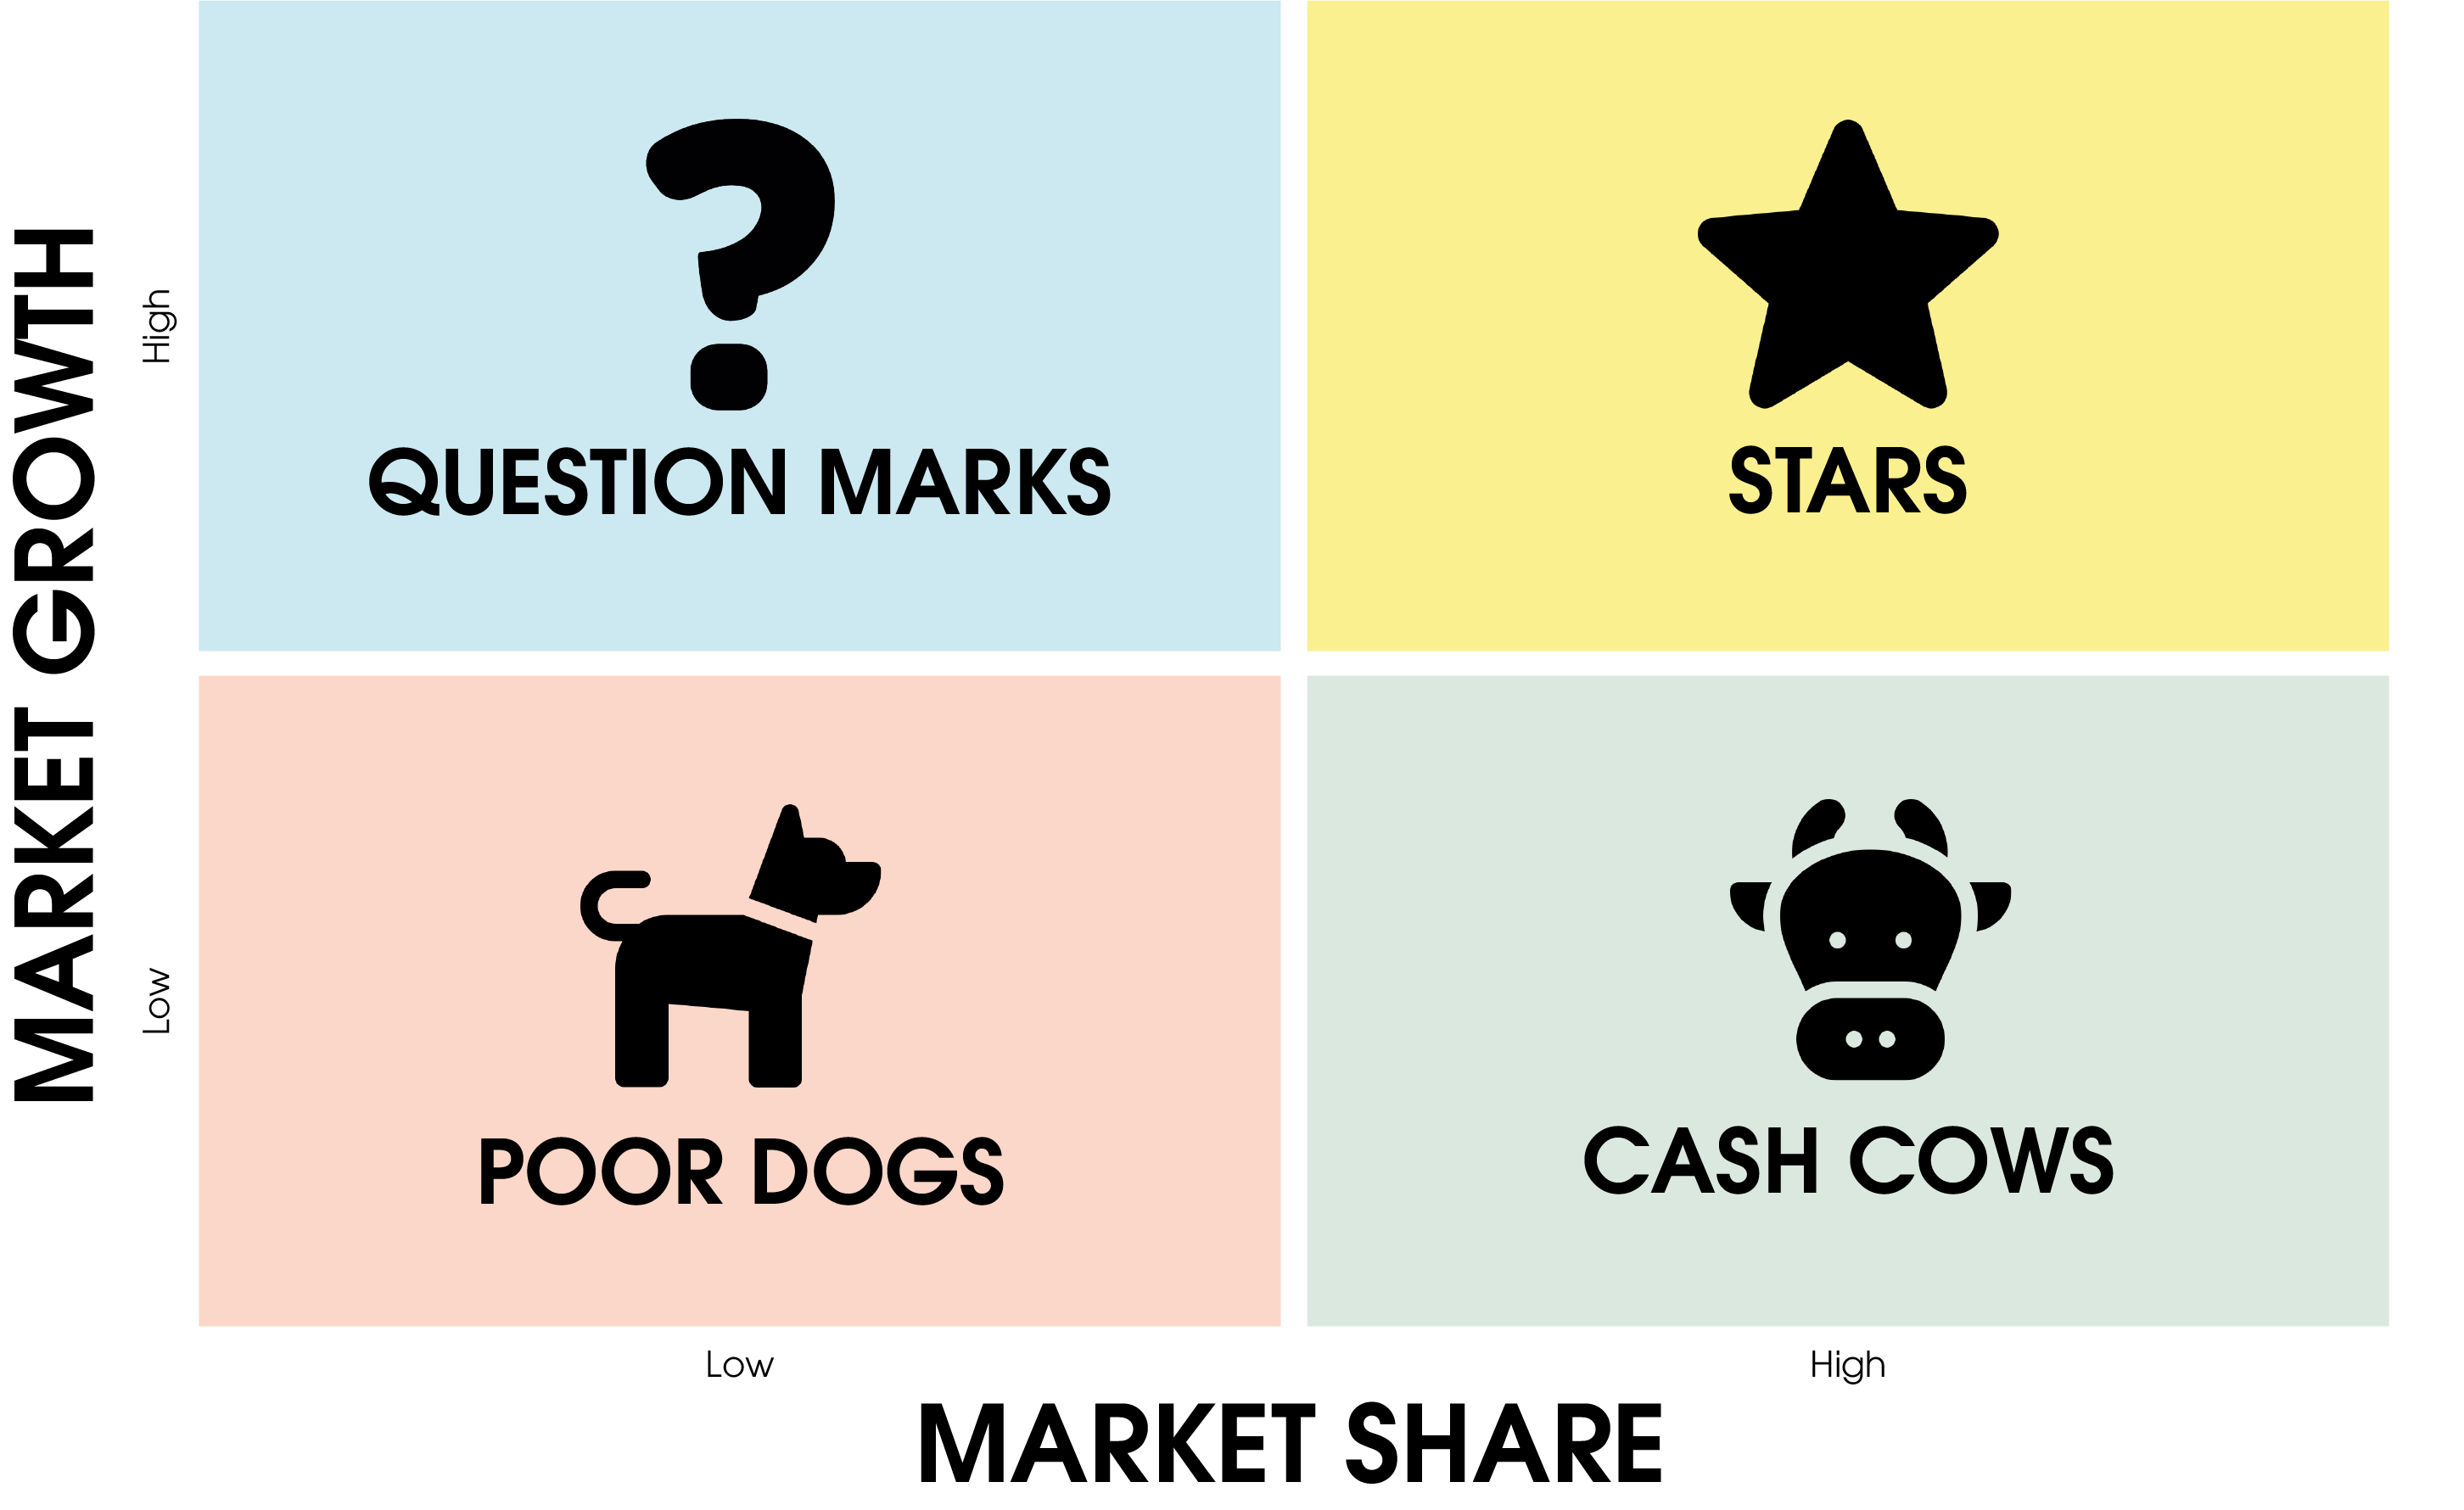
You assign products to this field that are still in their growth phase. For these items it is not yet foreseeable whether they will become a bestseller or a slow seller. In order to turn your product into a bestseller, large investments are often necessary. That’s why you should always keep a close eye on these items. Often product innovations are question marks.
Your products in the star segment have a high market share and high growth. They represent your best sellers. They are the items that bring you the most profit. For your stars you should keep an eye on your investments. If your product loses market share and growth, it may make sense for you to part with this product in a timely manner.
Your cash cows include items that have achieved a high market share after the product launch, but whose growth rate has fallen. Since sales here are almost self-generating, you do not have to make any major capital expenditures.
In your portfolio analysis, poor dogs are those products that have neither a large market share nor a growth trend. You can give these items a second chance by restarting their product life cycle with a relaunch or a new innovation. Otherwise, it makes sense to part with these items.
You can create your own portfolio analysis in just a few steps. To do this, you need to collect and analyze your most important data. Take the time to perform all the steps carefully.
Consider which products and services you offer on the market. For all of them, note down sales, market share, market growth and the market share of your strongest competitor.
As soon as you have conscientiously determined your values, they are entered into the BCG-Matrik, for example. You get a first overview of the actual state of your articles and services. It is perfectly okay if products cannot be entered directly into only one matrix field. For example, one of your products may be in transition from the Question Marks section to the Stars section. Draw this in the overview as well.
Based on the overview you have created, you can develop your further strategic approach. To do this, think about the value of the various products or services for your company. You should also think about the potential of your question marks and whether they should be promoted. From your matrix it can be derived which products are with the Poor Dogs and whether you would like to bring these revised again on the market. These products then start a new life cycle and begin again with the Question Marks. Develop measures for the articles of your stars and cash cows to support them in the long term.
A customer portfolio analysis can show you how to better serve existing and potential customers. The analysis can give you information about how you can best address your customers and how you can retain them in your company. You can also get an overview of how you can generate even more sales with existing customers or how you can win back lost customers. In general, you should treat all your customers individually. Remember: Each of your customers has a different importance for your business.
The Boston Consulting Group’s matrix has been expanded by management consultants McKinsey to better identify weaknesses and more effectively address them. McKinsey’s matrix is also widely known as the 9-field matrix. However, in creating the analysis, market growth is replaced by market attractiveness and market share is replaced by relative competitive strength. The 9-field matrix is divided into 3 different zones:
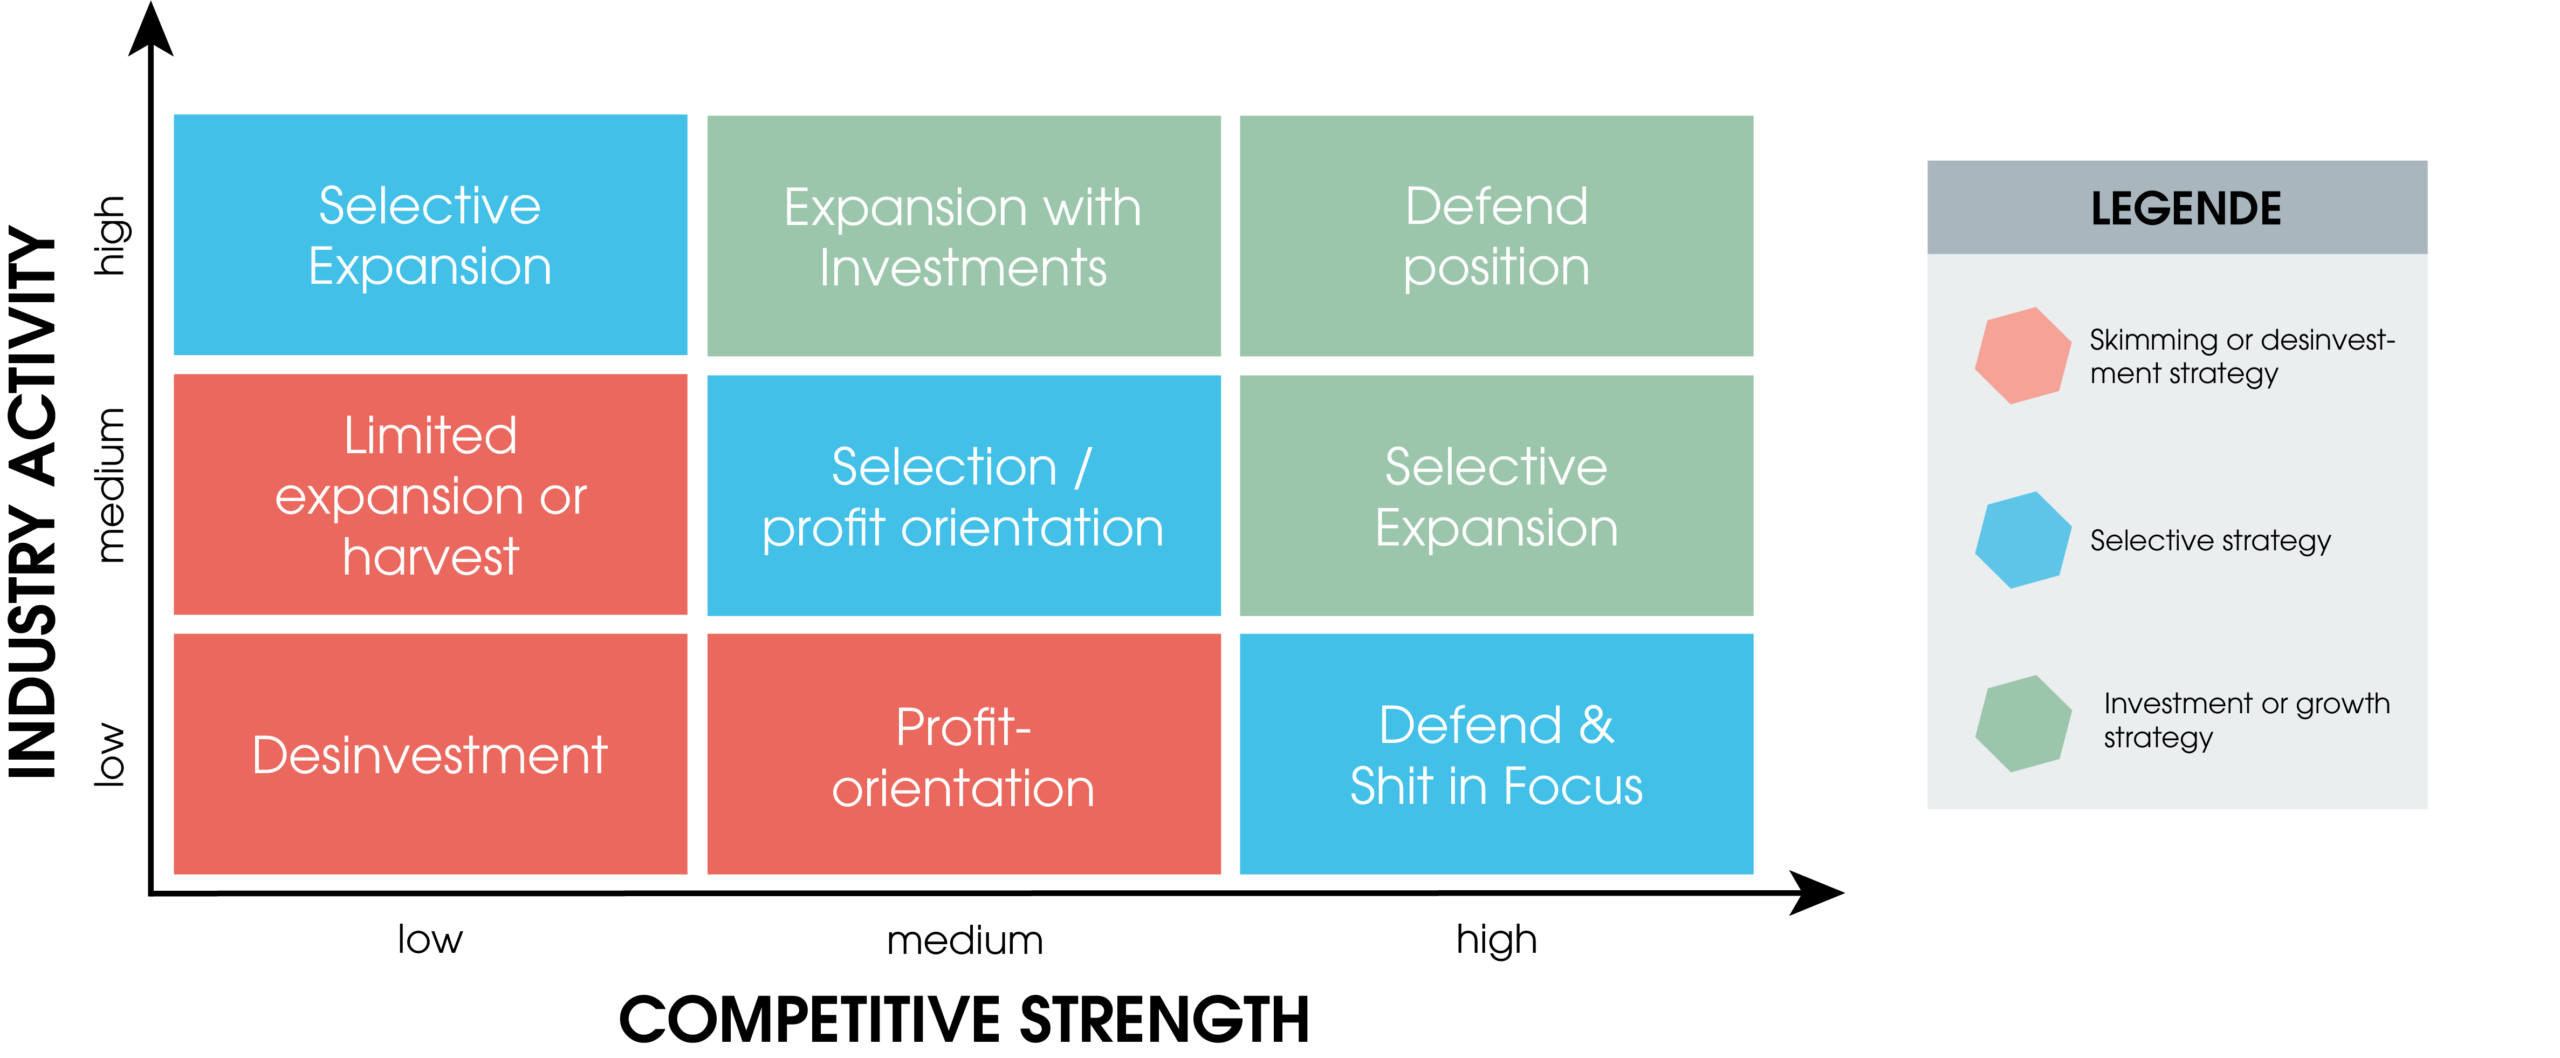
The advantage of the detailed analysis is that both internal and external factors are taken into account. However, in this matrix, the factors and weightings are subjectively selected. Another weakness: New competitors or technological advances may not be taken into account.
In online marketing, you have a wide range of options at your disposal. How they work and how you use them, you will learn here! ... Continue readingOnline Marketing
HTTPS is an extension of the HTTP protocol and provides more security on the Internet. We explain how HTTPS works. ... Continue readingHTTPS
What does traffic mean? And what is the difference between organic and paid traffic? We'll tell you! ... Continue readingOrganic Traffic
You want to learn more about exciting topics?