Google Looker Studio: A guide to data-driven visualisations
06 min
eologyeo:magazineGoogle Looker Studio: A guide to data-driven visualisations
What is the Google Looker Studio?
Definition
The Looker Studio (formerly Google Data Studio) is an evaluation and data aggregation tool from Google that makes it possible to combine different data sources and make them visible with the help of visualisations. This allows traffic flows, conversion statistics, rankings or sales trends of a website or app to be bundled and compared in one place.
Areas of application
Management level
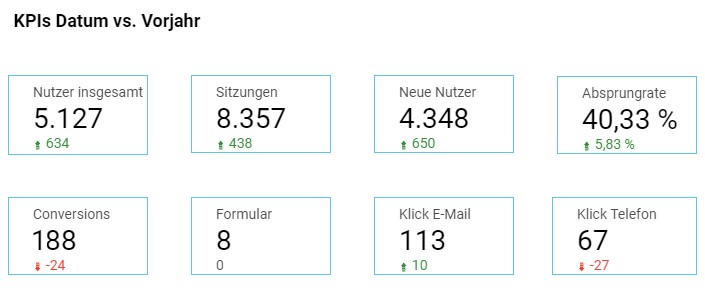
A Looker Studio is ideal for managers who want to get a quick overview of the most important KPIs and all relevant information. This allows them to keep an eye on important figures on a daily basis and react quickly should any irregularities occur. At the same time, long-term developments can also be visualised, providing a reliable overview of a company’s growth.
Project management level
By connecting Google Docs (especially spreadsheets) or other project management tools, such processes can also be mapped in Looker Studio. Project progress, days absent, turnover per capita, sprints, utilisation charts or resource planning can be visualised effectively.
Operational level
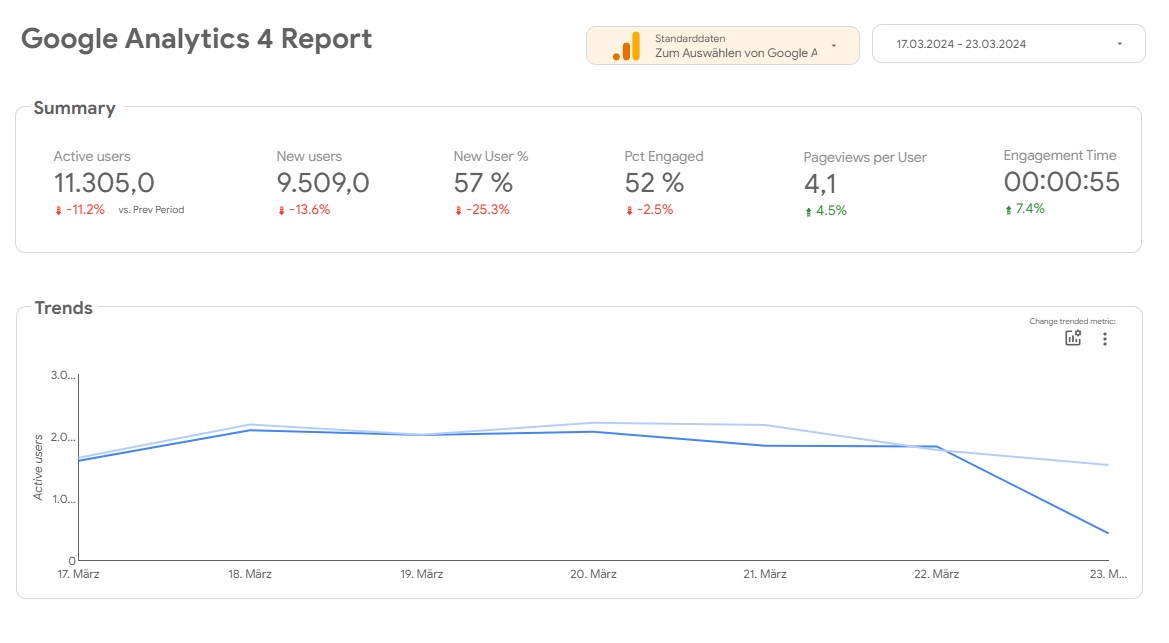
The Looker Studio reports are ideal for setting up tracking monitoring. For example, user flows from Google Analytics or impressions and conversions from a Google Ads account can be visualised in a graph. If these KPIs suddenly drop to zero, it can be assumed that there is a problem with the analytics tracking on the website or with the payment methods in Google Ads. The Looker Studio can also be a reliable monitoring tool for the SEO and SEA departments, in which rankings for various keywords or costs and performance of ad accounts are mapped.
Tracking monitoring in Google Looker Studio: Drop in users and conversions due to malfunctioning tracking after update
Reporting for customers
For agencies and freelancers, the Looker Studio can also be used to provide clients with a kind of reporting dashboard that can always be viewed live and provides all relevant marketing key figures. The manually fillable text elements can also be used to record current agreements, to-dos or special features.
Advantages
Google Looker Studio is a powerful tool for data analysis and combines a variety of benefits compared to expensive and complex BI solutions:
Merging different data sources
Largely free of charge to use
Seamless integration of all Google services
retrievable via a web link with different access levels
easy-to-use web interface
Interface can be used digitally and interactively (filter, date, mouse hover, sorting function, etc.)
Many visual customisation options
API connection
Embedding options
Disadvantages
On the other hand, there are a few disadvantages:
depending on the size of the data volume to be processed, long loading times of the interface
Data sources outside Google can sometimes only be used with paid connectors
Interface not mobile-optimised & responsive
Limited transfer of ownership of a report
Some familiarisation time required
Create Google Looker Studio
To create Looker Studio reports, all you need is a gmail address or an email address that is linked to gmail. At Looker Studio site you can create any empty report.
Select template
For a quick start, you can also select various templates from the gallery, which already contain many helpful diagrams, charts and visualisations.
Google Looker Studio template for the integration of data from Google Analytics
Add data sources
Via Resource > Manage added data sources, you can choose from almost 1,000 different data sources and connectors. It is particularly important for all data sources from the Google universe that the email address you use to create the Looker Studio must also have rights and access to the Google tools (e.g. Search Console, Google Analytics) in order to link data to the Looker Studio. As soon as the link has been created, the corresponding data source can be assigned to all inserted and existing elements.
Inserting elements into the Data Studio
The Looker Studio provides a variety of chart types, history charts, tables or interactive geo-maps. Filters can also be manually applied to these diagrams using various control elements. For example, the figures in charts change if a date control field is linked and a new analysis period is defined.
Customise elements
All elements can be extensively customised. In addition to the KPIs and figures to be displayed, the fonts, colours, size, shading or axis names of all elements can be defined individually. Additional free text fields can also be created, images or logos uploaded and even YouTube videos embedded. These extensive customisation options make it possible to give each Looker Studio report an individual look (e.g. CD colours of a company).
Popular data sources of the Looker Studio
Google services
Google Analytics
With Google Analytics as a data source, all known measurement values from the tool can be exported and visualised: These include users, events, conversions, channels, locations, demographic data as well as common KPIs such as sales, conversion rates or bounces. In addition, various KPIs can be correlated, e.g. landing pages with the most users, channels with the most sales or products with the most transactions.
Google Search Console
The biggest advantage of connecting the Google Search Console is the visualisation of ranking positions without having to resort to paid tools. In addition, all organic clicks and impressions of all indexed pages can be retrieved from the Search Console.
Google Ads
With the link to Google Ads, all decision-relevant KPIs can be pulled from the Google Ads interface into Looker Studio. Campaigns can be displayed with the desired KPIs (e.g. impressions, clicks, conversions, CPCs, costs per conversion, ROAS, etc.) in tabular form. The development of the various KPIs over time can also be displayed.
Google Tables
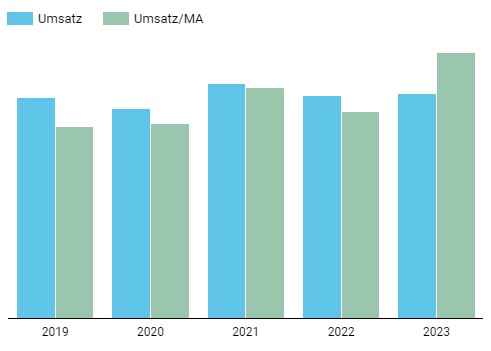
There is great potential in the use of Google Tables, independent of tools and connectors, as the data stored in the tables can de facto be used to visualise any process.
Google Looker Studio Visualisation of sales trends with the help of Google Sheets
Selected connectors
Supermetrics
Supermetrics offers a variety of connectors for online marketing channels and platforms. These interfaces can be used to easily connect data from Facebook, Instagram, Adobe Analytics, Pinterest, LinkedIn, Microsoft Ads or Hubspot to a Looker Studio. Supermetrics connectors are usually subject to a fee.
Sistrix
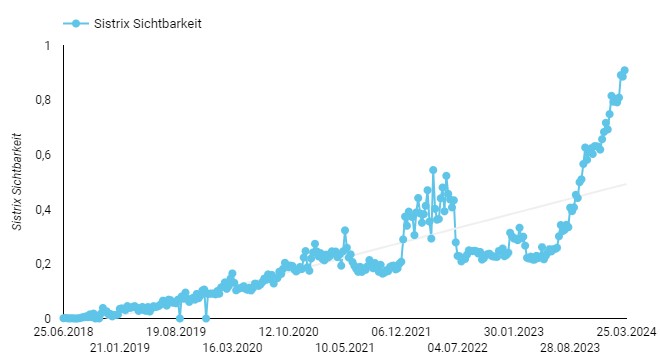
With the free Sistrix connector, various metrics can be imported via the Sistrix API Credits. For example, the development of the visibility index or the number of top 10 keywords can be easily transferred to a Data Studio.
Visibility index from Sistrix, integrated into Google Looker Studio with the help of the Sistrix connector
Professional tips for using the Looker Studio
Inner & outer join for conversion segmentation
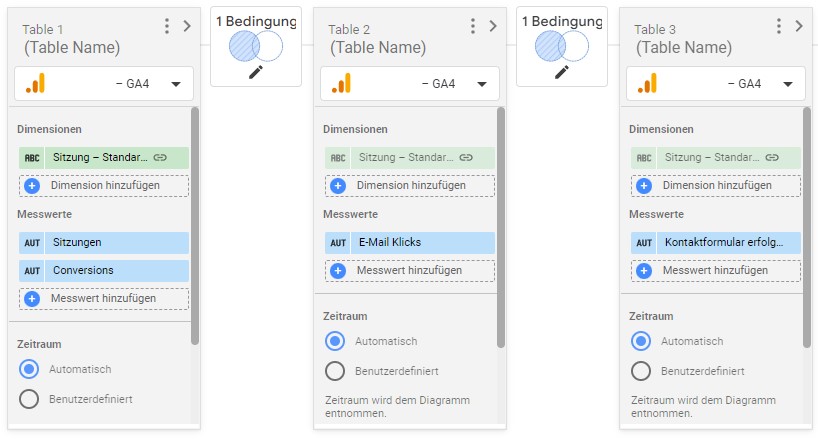
Several events are often tagged as conversions in Google Analytics. In order to segment this total number of conversions in the Looker Studio report according to the respective type of conversion, data needs to be merged. In the example below, you can see how the KPI conversions can be separated into the individual segments (contact form sent & click on email) with a left outer join condition.
Merged data with left outer join command for segmenting conversion actions
It is then possible to display the corresponding conversion types separately as a data set.
Segmented conversions with outer join condition
Mapping ranking development with the Google Search Console
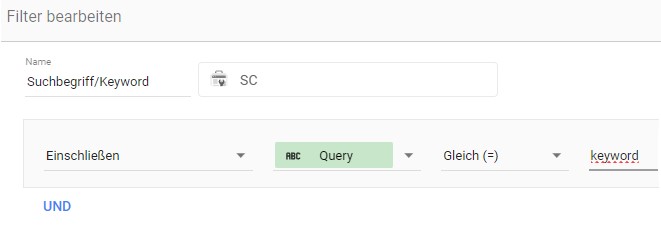
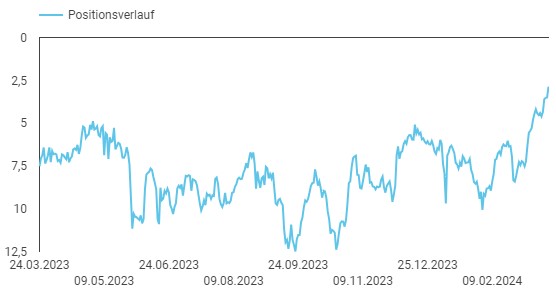
The Looker Studio is ideal for determining the ranking development of certain keywords with the help of the Google Search Console. To do this, you need to place a filter over a time series diagram that picks out the exact search term from the Search Console search report.
Filter setting for a specific search term from the Search Console
Ranking development of a keyword from the Search Console
Alex Rasper is Head of Online Marketing at IronShark GmbH and an independent online marketing expert (Klickstream). He has been advising companies on organic and paid visibility in the Google search engine for over 14 years. He uses the Looker Studio intensively to map all marketing and project management processes for his clients.
Product descriptions are essential - customers need information about products before they can even think about making a purchase. Depending on the complexity of the article, sometimes more, sometimes less text is needed on a product page to provide potential buyers with the most important information. Find out here in detail what you need to pay attention to. ... Continue reading
SEO, Search Engine Optimization or Search Engine Optimization - you've probably heard these buzzwords from time to time. But what is behind it? What is SEO and why do you need it? You can read that and much more here. ... Continue reading
Google Alerts is a useful tool that helps you keep up to date with all the topics that interest you. Learn how to use this tool, how to use it correctly and how to get the most out of it here! ... Continue reading